| Home | Syllabus | Schedule | Lecture Notes | Extras | Glossary |
| Home | Syllabus | Schedule | Lecture Notes | Extras | Glossary |
We began this talk with a definition of genomics, although we have been introducing aspects of genomics for some time now. When we talk about genetics, we usually mean looking at the role of a few genes at a time. Genomics is the study of the whole of the genome in an experiment.
It is useful to trace the development of genomics as applied to a specific problem: measuring gene expression. We will look at gene expression in three eras: the 1980s, the late 1990s, and the present.
In 1980 and the decade of the 1980s, recombinant DNA technology was developing. The approaches to studying gene expression included the construction and screening of cDNA libraries, and using Northern blots to analyze tissue-specific gene expression. The figure below shows the screening of a cDNA library next to a personal computer from 1980.
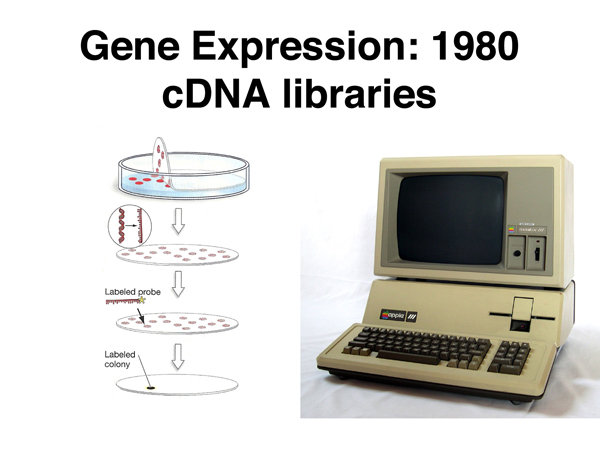
Historical Perspective: The Apple III computer shown from 1980 had an 8-bit processor running at 2MHz, 128-256 kb of RAM, and a 560 x 192 monochrome display that could show 24 lines and 80 columns of text. The Internet existed only as a DARPA project at the time.
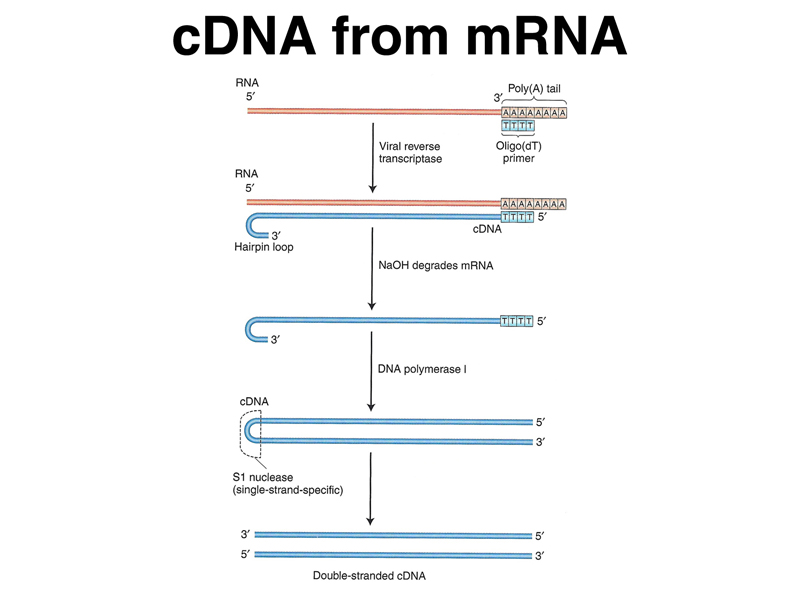
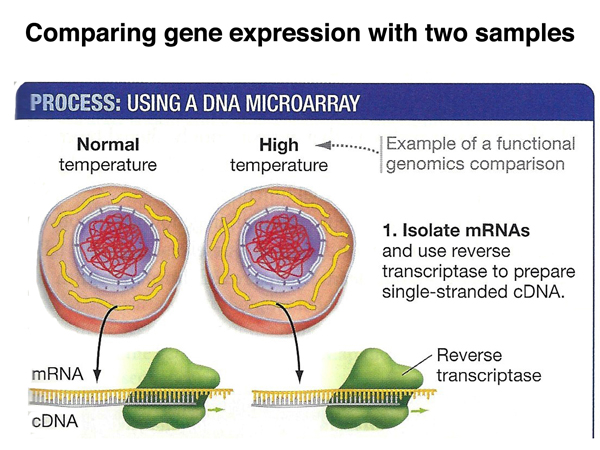
We have previously described the synthesis of complementary DNA (cDNA) from mRNA, using viral reverse transcriptase to synthesize DNA from an mRNA template as shown below. Because eukaryotic mRNAs have poly-A tails, we can use oligo(dT) primers to copy only the mRNA and not the rRNA and tRNA that make up 95% of the RNA in a cell. Once we have double-stranded DNA copies of the mRNA in a cell, we can clone the DNA into a cloning vector to make a cDNA library.
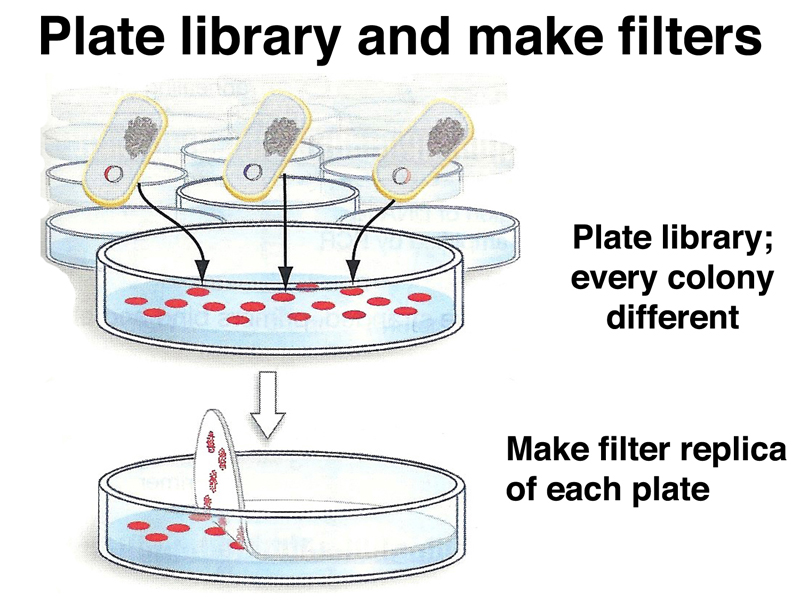
We can screen a cDNA library just as we would screen a genomic library. As shown below, we plate the library on multiple plates, making a filter replica of each plate.
We then hybridize a labeled probe to the filter replicas as shown below. There are a number of different types of strategies used to obtain probes. If we have the genomic copy of a gene, we can screen a cDNA library with the labeled genomic probe to obtain a cDNA derived from that gene. We can also undertake differential screening with a complex mixture of cDNAs. In differential screening, we might look for cDNAs expressed in the pancreas but not in the liver by making cDNA from pancreas, then using an excess of cDNA from the liver to "subtract" common cDNAs by hybridization. Pancreatic cDNAs that didn't hybridize to liver cDNA would be labeled and used to probe a cDNA library. There are many other strategies to screen a library.
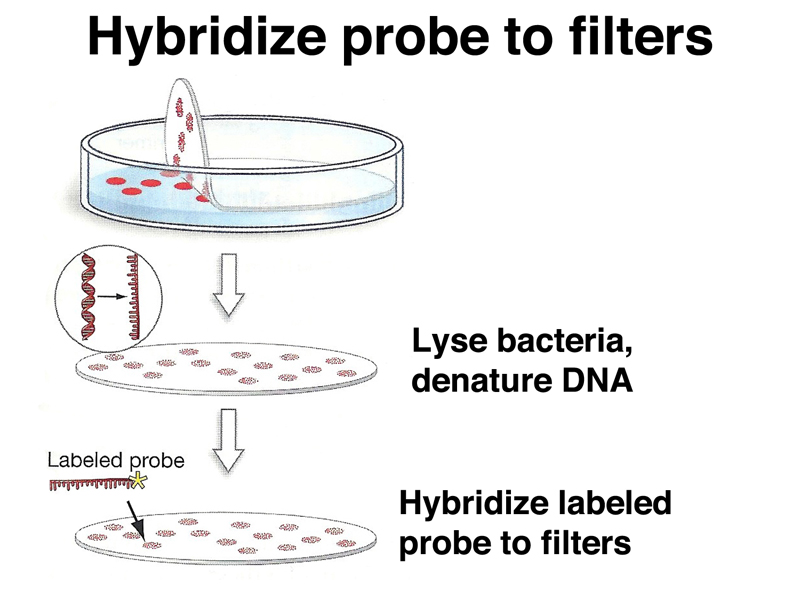
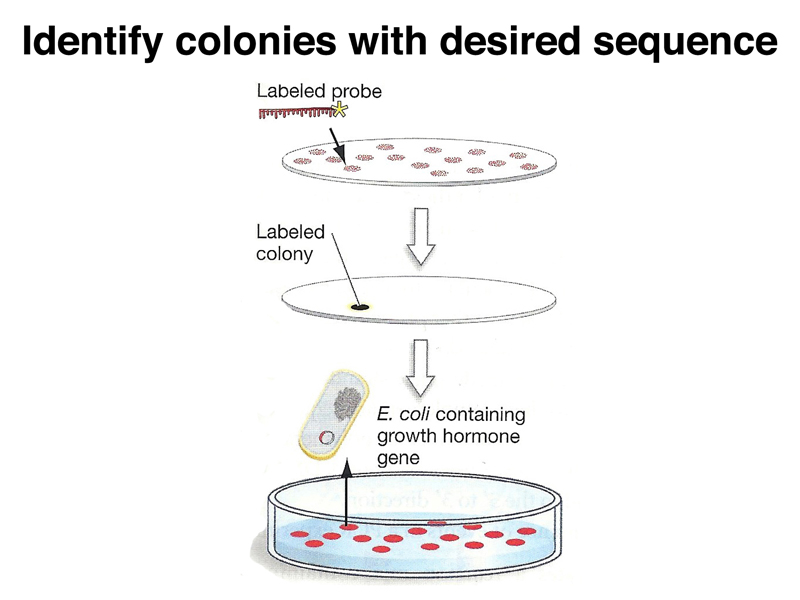
As in screening a genomic library, a signal on the filter replica lets us pick the appropriate plaque or colony from the original plate, as shown below.
One of the most immediate uses of a cDNA clone is to determine the DNA sequence, in order to predict the sequence of the encoded protein. The predicted protein sequence is then used as the query sequence in a BLAST search to identify similarites to other proteins of known function. This approach revealed the function of a large number of genes known only by the phenotypes produced by variant alleles.
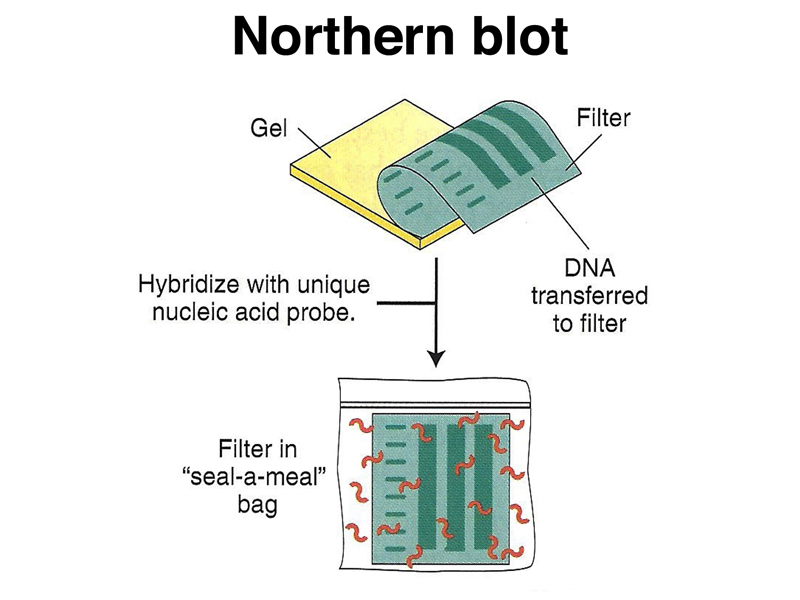
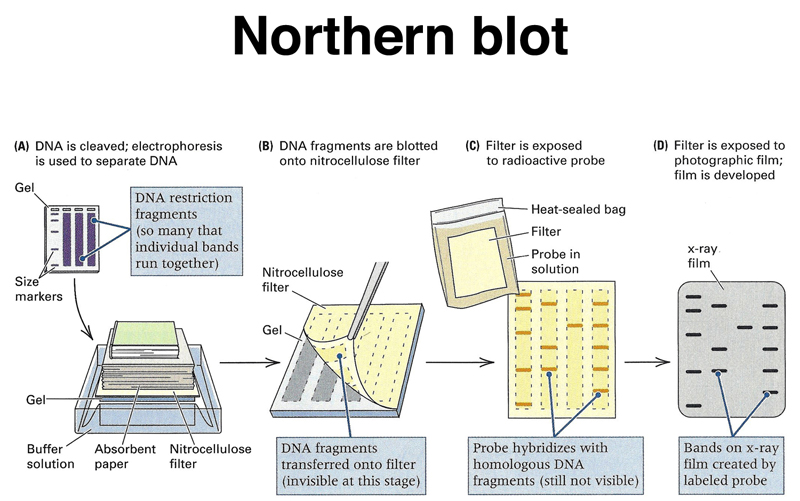
Once we have an appropriate cDNA or genomic probe, we can assay the expression of that gene in different tissues or under different experimental conditions using a Northern blot. We can run total RNA or mRNA from different samples on an agarose gel, then blot the gel to a filter replica, as shown below. This is called a Northern blot. If we were to run DNA on the gel, this would be a Southern blot.
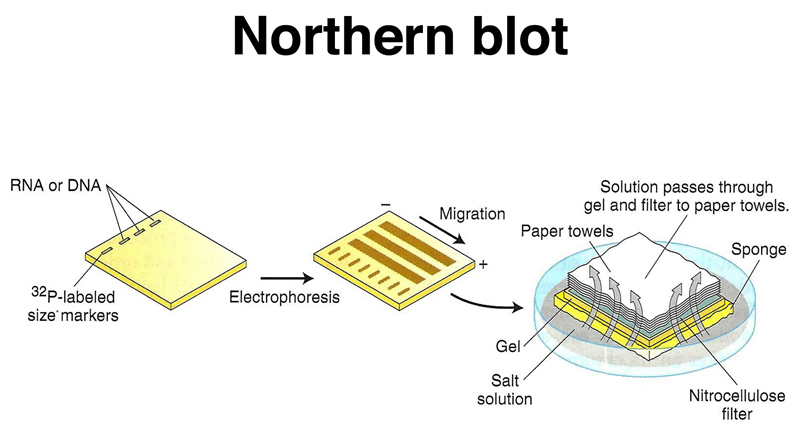
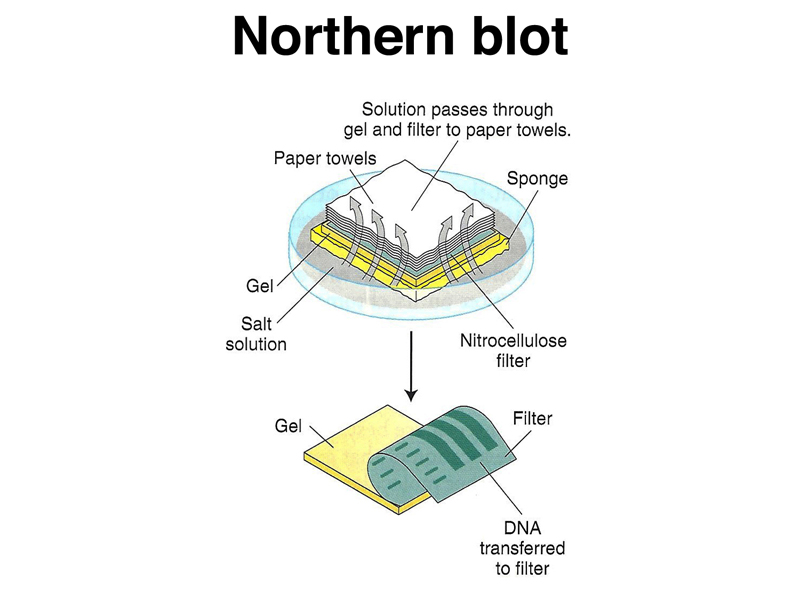
The RNA from the gel is transferred to the filter, as shown below.
We hybridize the filter to a labeled probe, as shown below.
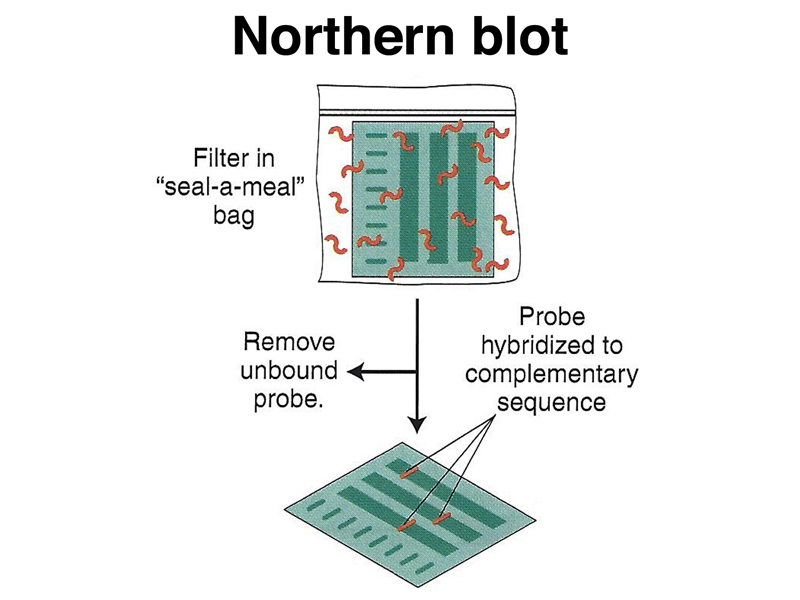
Washing the filter leaves labeled probe hybridized to the complementary sequence, as shown below.
We can detect the labeled probe by autoradiography, as shown below.
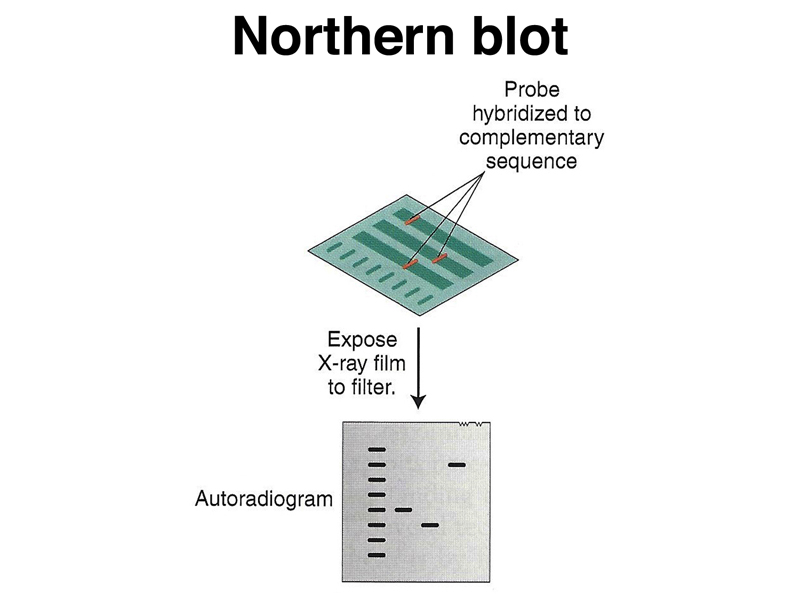
The entire process is shown in summary below.
The results of a set of Northern blots, using RNA from a variety of tissues, are shown below. A "housekeeping" gene that is expressed more or less uniformly in all cell types is used as a control. Here, β-actin is the control. The experiment measures the expression of two other genes in these tissues.
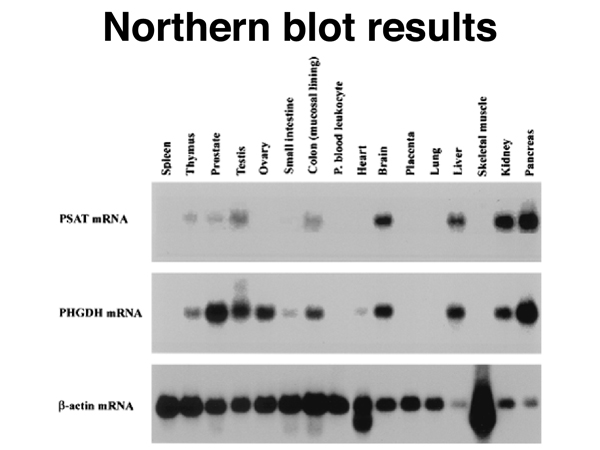
Notice that there is no expression of either gene in skeletal muscle. The β-actin signal is very high here because the lane from skeletal muscle has been overloaded with RNA in an attempt to detect expression of either gene. You can see differences of expression of the two genes in several tissues, including ovary, small intestine, and heart. The technique is semiquantitative.
Northern blots allow the detection of expression of sets of genes in different tissues or in cells exposed to different experimental treatments. The technique is labor-intensive, and a different blot is needed to examine the level of expression of each gene of interest. This is not a "genomics" approach.
The technique of microarrays came into use in the late 1990s. A large number of cDNA clones were available from selected model organisms. A large number of cDNAs can be spotted onto an array that is used to determine changes in the level of expression of all cDNAs in a comparison of two samples. The figure below shows experimental results from part of a microarray next to a personal computer from that era.
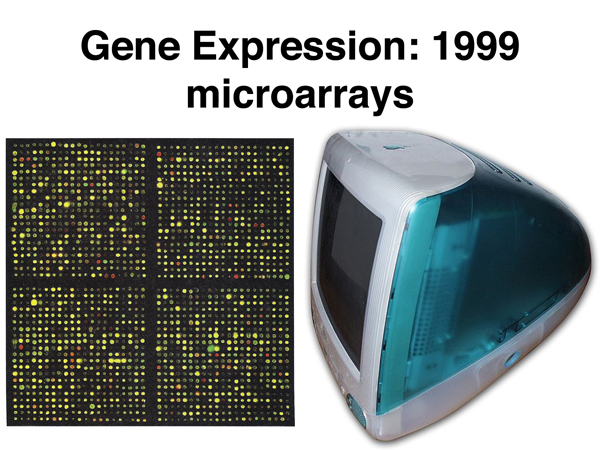
Historical Perspective: The iMac G3 shown from 1999 had a 32-bit processor running at 233MHz, 32 Mb of RAM, and a 1024 x 798 CRT display. The Internet had been open to the general public for five years.
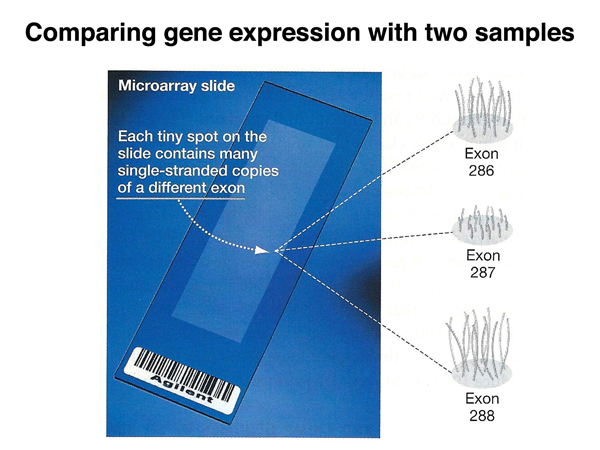
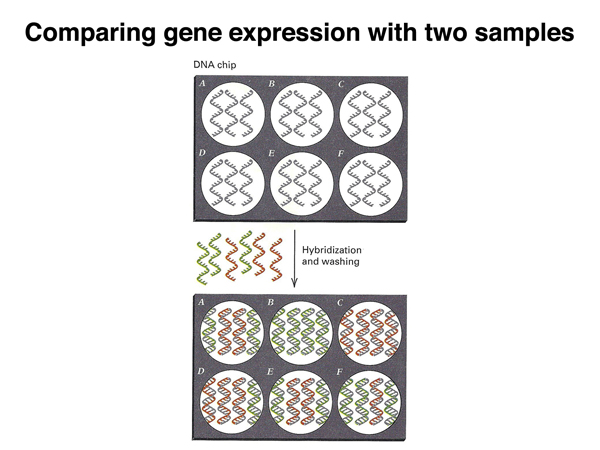
As shown in the figure below, a microarray is a glass microscope slide containing thousands of spots, either cDNA clones or synthetic oligonucleotides. In the example below, each spot is a single exon from a known gene.
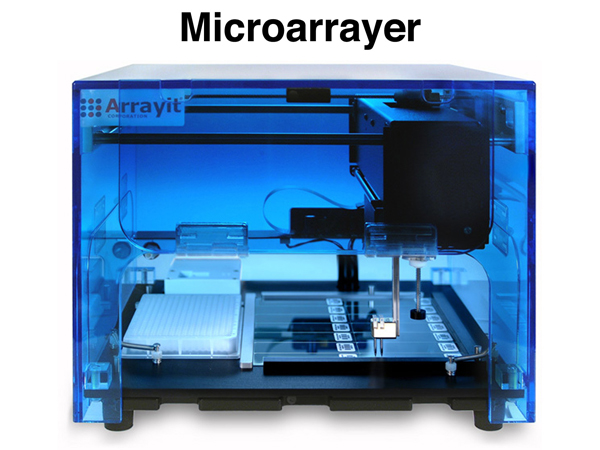
Microarrays are "printed" using a robotic microarrayer, shown below.
In the experiment outlined below, we compare the mRNAs of control cells to mRNAs from cells exposed to high temperature. As shown below, the mRNAs from the two samples are made into cDNA.
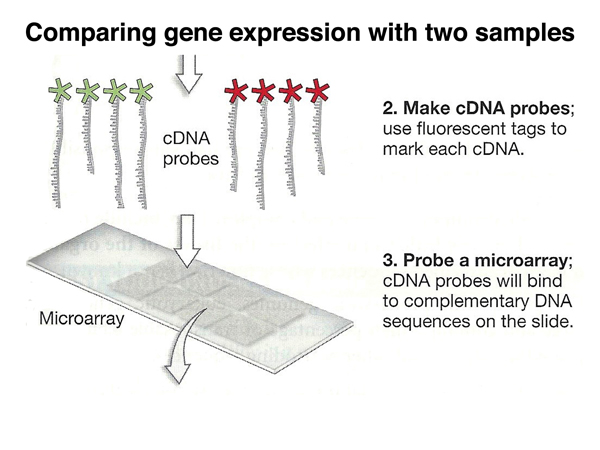
In order to distinguish the experimental samples from the control samples, we label the two different collections of cDNAs from the two samples with different colored fluorescent tags, red and green in this example. The labled cDNAs are mixed and used to probe a microarray.
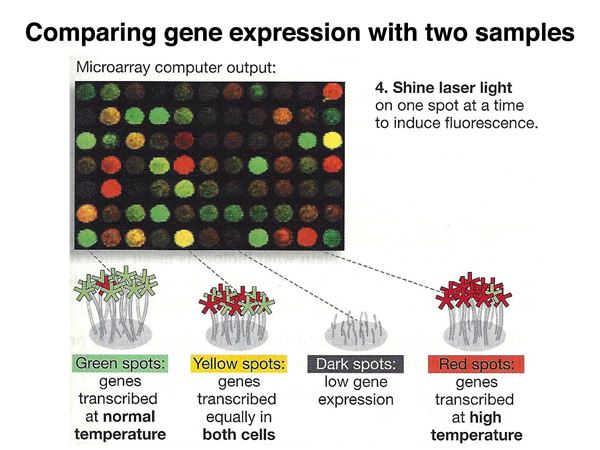
We photograph the microarray using a microscope while illuminating the array with UV light, as shown below. In this example, green spots are genes expressed in the control but not the heat-treated cells, red spots are genes expressed in the heat-treated but not the control cells, and yellow spots are genes expressed in both samples (green light + red light is yellow).
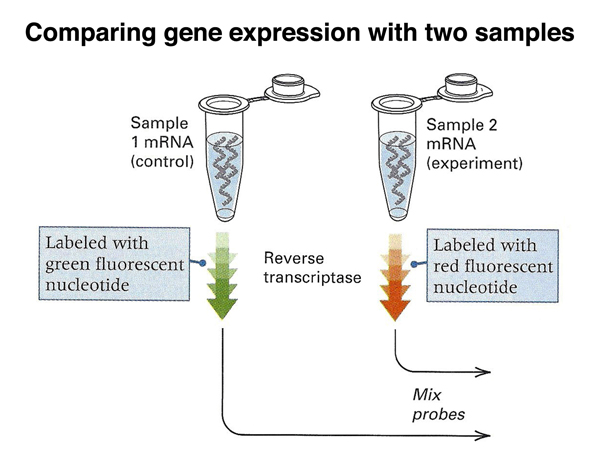
The figure below is another representation of labeling the experimental and control cDNAs.
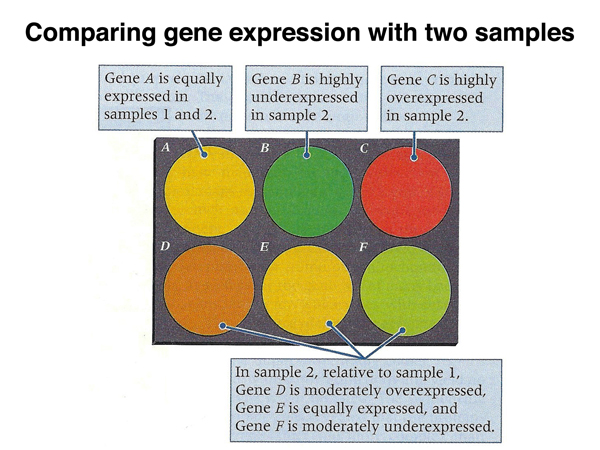
As shown below, cDNAs present exclusively in the control sample will produce green spots (e.g. spot B), cDNAs present exclusively in the experimental sample will produce red spots (e.g. spot C), while cDNAs present in both samples equally will produce yellow spots.
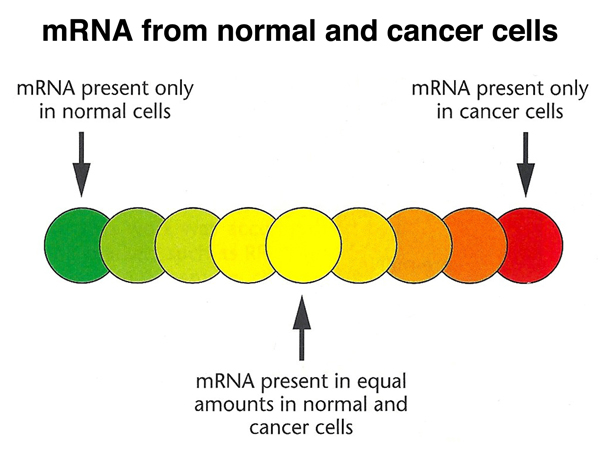
The assay is actually semiquantitative, with a full range of colors between red and green showing the relative abundance of a particular cDNA in the two samples, as shown below.
This allows the interpretation of the color of each spot, as shown below.
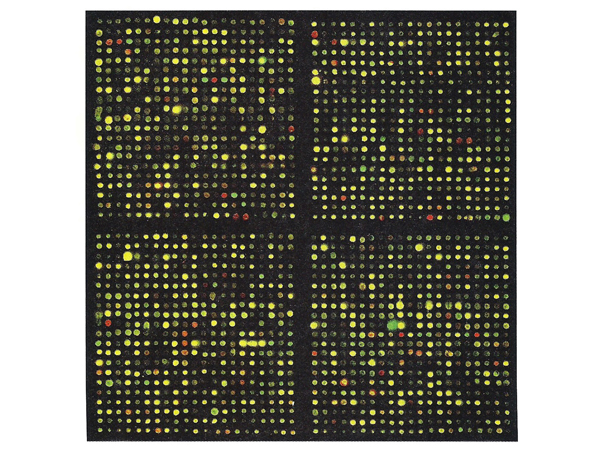
The image below shows actual results from part of a microarray. Most spots are yellow (equal expression in both samples), while red and green spots reveal differences in gene expression between the two samples.
Although it is somewhat counterintuitive, in some cases many inaccurate measurements are better than a few accurate ones. This is the case for microarray data. The best way to view the results of a microarray experiment is not as individual assays, but as patterns of changes in gene expression that can be used to sort samples into classes.
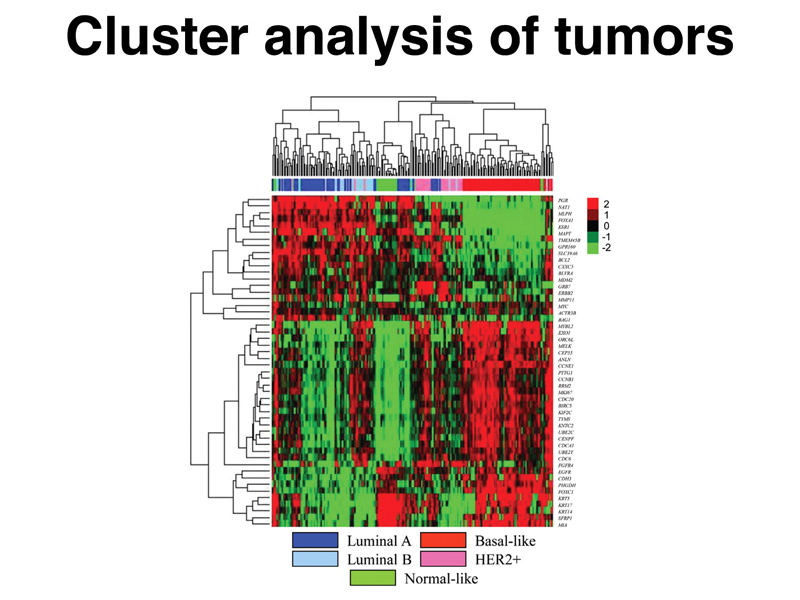
Cluster analysis is a statistical method that is used to sort microarray data. The image below shows samples from a large number of breast cancers (columns), assayed using microarrays for changes in the expression of a set of genes (rows). The data have been sorted using cluster analysis. In this example, green is an increase in expression in the tumor relative to control, while red is a decrease. This is the usual convention.
You can see that the first branch of the clustering of genes and the first branch of the clustering of tumors sorts the data into classes that you can understand. The tumors sort into those that generally have decreased expression of the first gene cluster (top left) and increased gene expression of the second gene cluster (bottom left), and tumors that generally have increased expression of the first cluster (top right) and decreased expression of the second gene cluster (bottom right). You can look at the next branches down to see further stratifications of the data. Notice also that tumors generally sort by type (color bar along top).
While it is possible to attempt to understand differences in the biology of these tumors from exploring the genes and pathways revealed through microarray analysis, the data are of use even if we don't understand exactly what they mean. This is illustrated in the series of slides below.
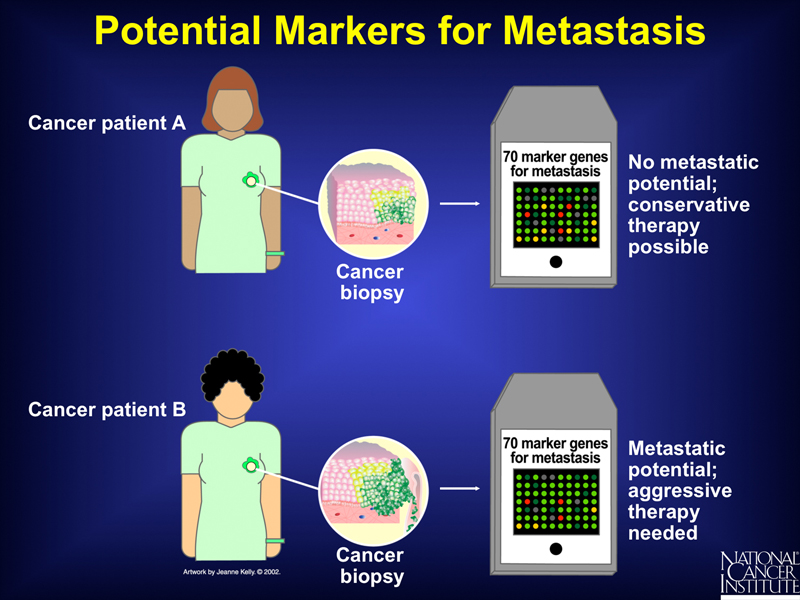
From the analysis of a sample of tumors of a similar type together with the patient outcomes, we can use microarray analysis in a clinical setting to predict which patients have tumors with a low potential for metastasis and which have a high potential. Patients whose tumors have a high potential for metastasis can be treated with aggressive therapy immediately.
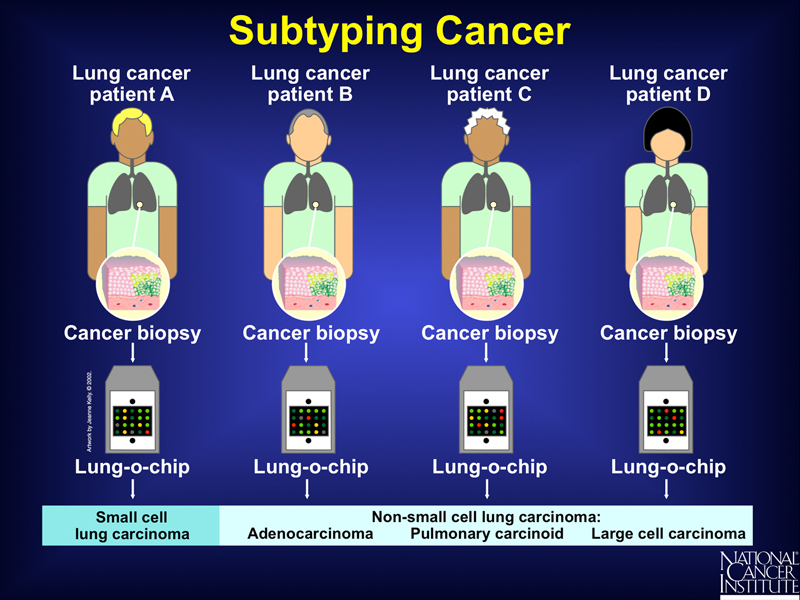
Microarray analysis can also be used to identity new tumor subtypes based on patterns of gene expression, as shown below. Pathologists classify tumors based on their appearance, but microarray analysis can identify different tumor types even though their appearance to a pathologist is identical.
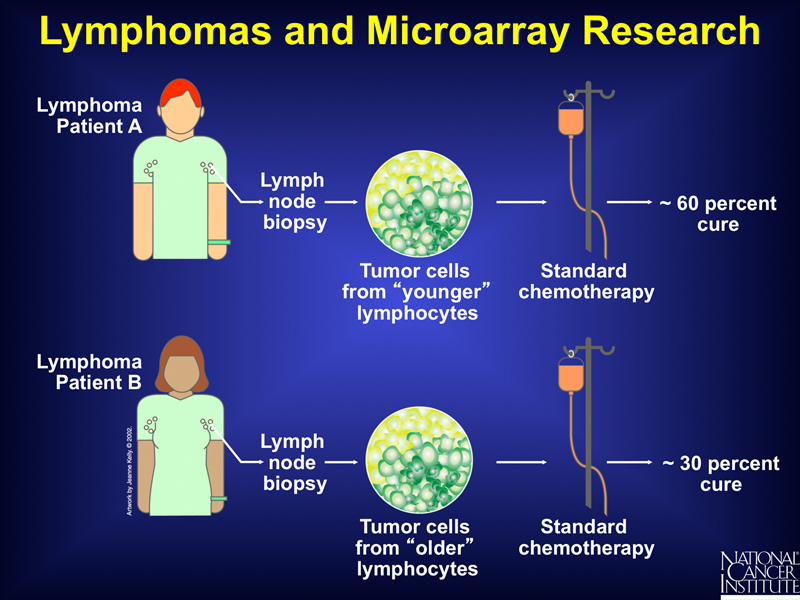
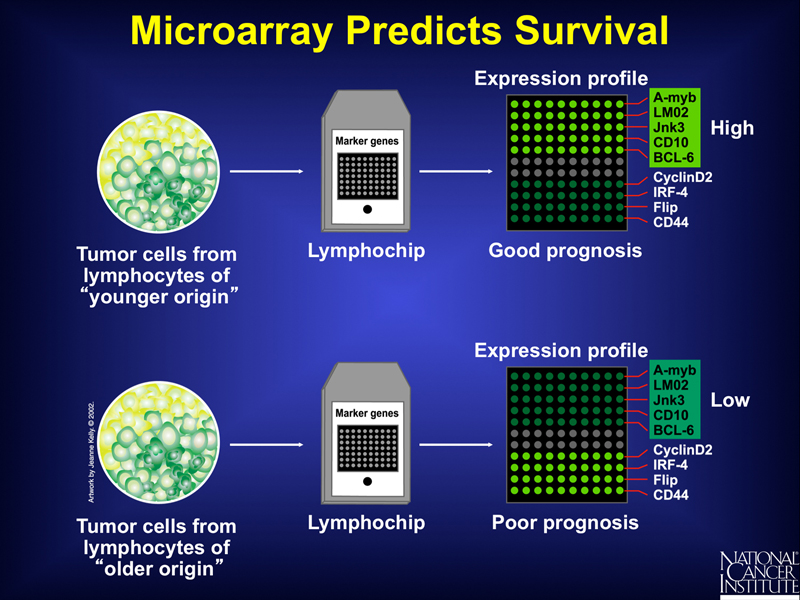
Microarray analysis can be used to determine the outcome of a standard course of treatment. In the example shown below, microarray analysis can stratify lymphomas into those derived from "younger" lymphocytes and those derived from "older" lymphocytes. Study of a group of these patients shows a different response to a standard course of chemotherapy.
Exploration of the patterns of expression of specific genes in the two classes of tumors might eventually provide insight into the mechanisms involved, but it serves as an immediate predictor of the outcome of standard therapy, as shown below.
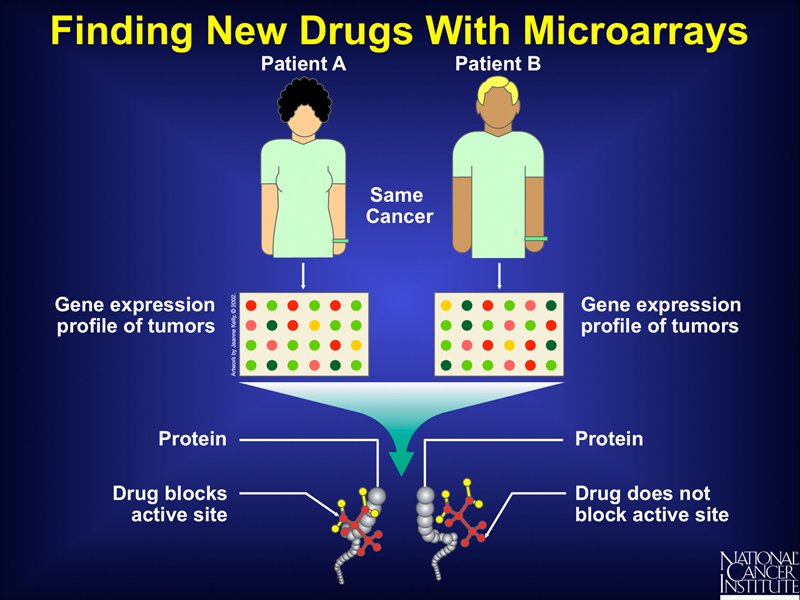
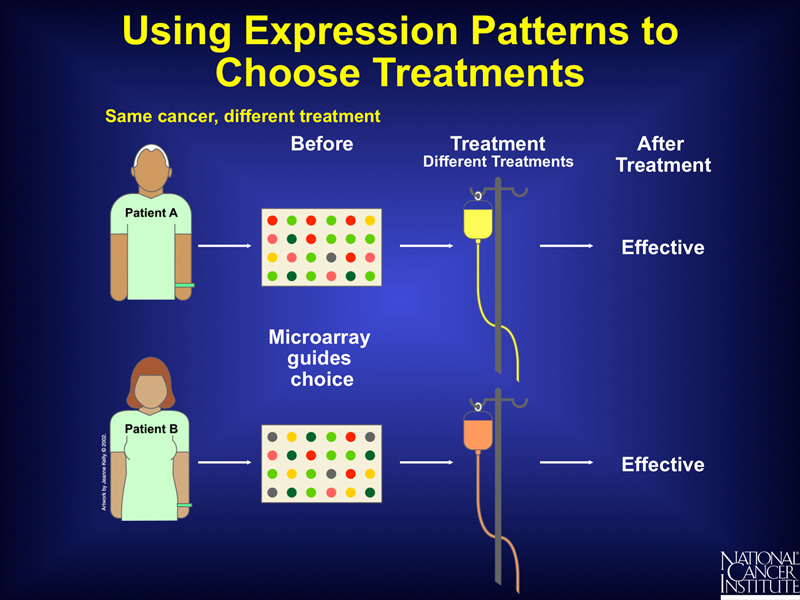
Differences in the patterns of gene expression in tumors that appear to be identical might also be used to identify drugs that would be useful in a particular case, as shown below.
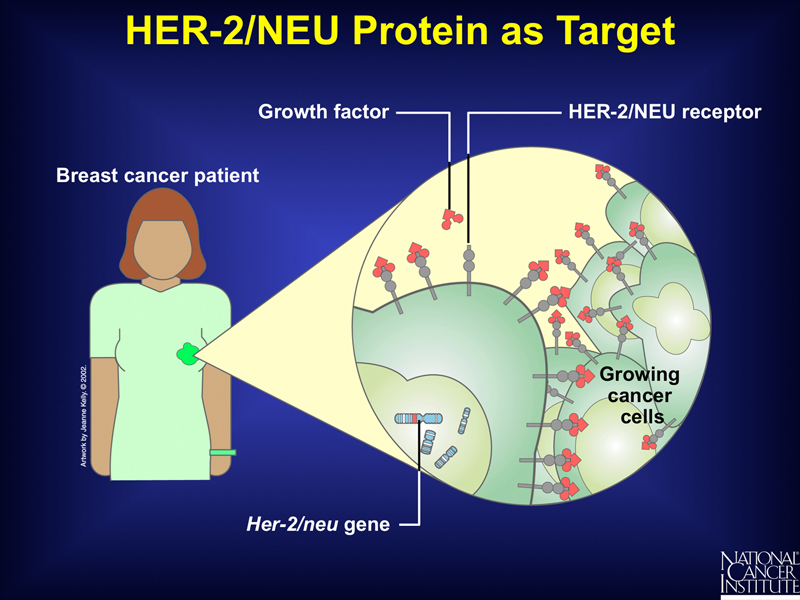
A particular example of this is shown below. Some breast tumors overexpress the receptor for a particular growth factor, so their growth is stimulated at lower levels of the growth factor. Tumors of this type can be identified by microarray analysis that shows overexpression of HER-2.
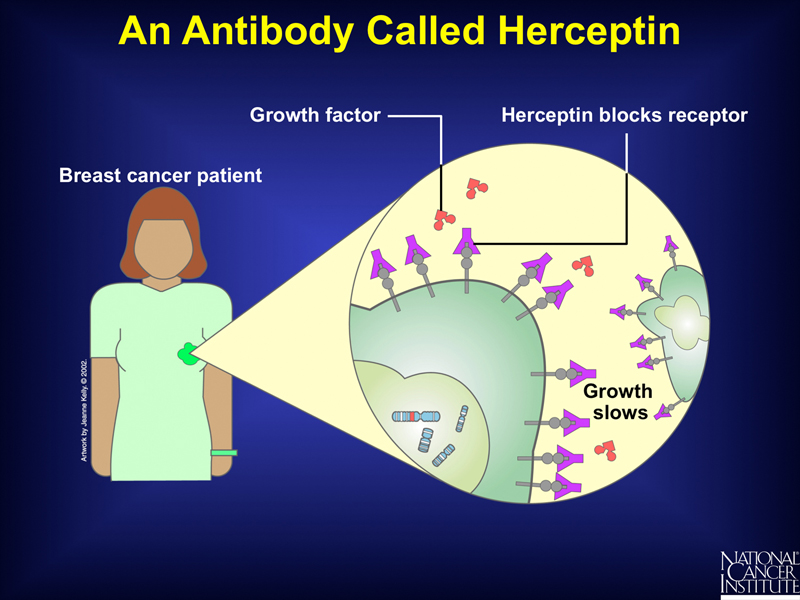
Patients whose tumors overexpress the gene for this growth factor receptor can be treated with a monoclonal antibody to the HER-2 protein called herceptin, as shown below. Herceptin binds the receptor without activating it, blocking the binding of the growth factor and slowing the growth of the tumor. Herceptin does not benefit patients whose tumors do not overexpress HER-2.
In general, the results of experiments that correlate patient outcomes with patterns of gene expression in their tumors can be used to select an optimal course of treatment for future patients. The course of treatment may differ among patients presenting with what appears to be the same type of cancer, as shown below.
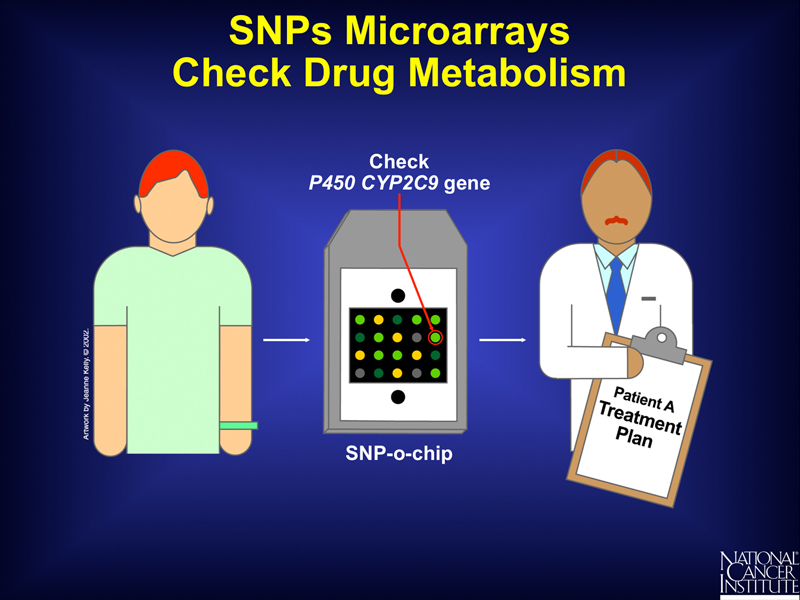
SNP chips, like those used by 23andMe, can be used to identify genetic variation in genes involved in drug metabolism, as shown below. The example used is a cytochrome P450 gene. These are involved in the metabolism of a significant fraction of the drugs currently in use. At the present time, a limited number of prescription drugs carry a "black box" warning requiring the genotyping of patients to determine whether the drug can be used at all, as well as in setting the optimal dose.
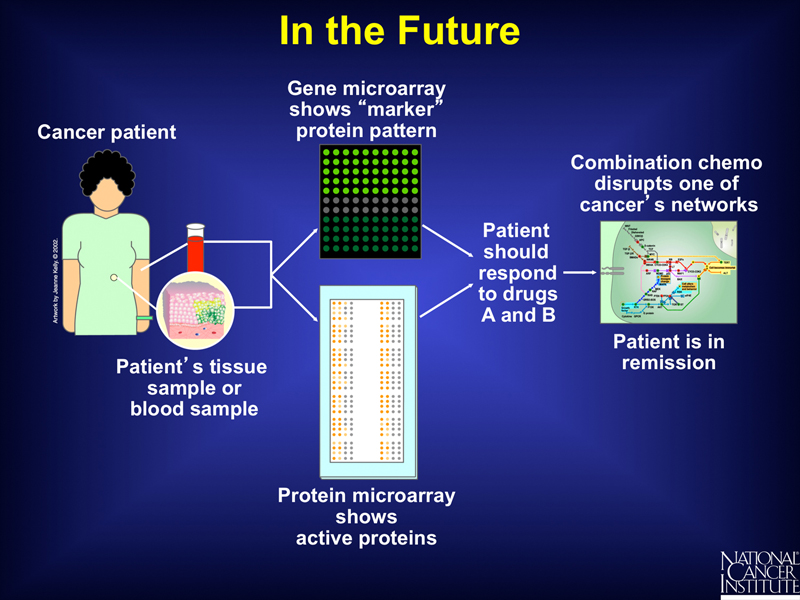
In the future, as shown below, genomic, microarray, and proteomic data might be used together to predict a combination of drugs that would provide an optimal therapy based on our knowledge of metabolic pathways. This might eventually allow the elimination of chemotherapy in favor of a targeted cocktail of drugs that are not generally cytotoxic.
In our previous discussion of the Human Genome Project, we distinguished between assembly (the construction of a model of the genome sequence) and annotation (the description of specific genetic elements on the assembly).
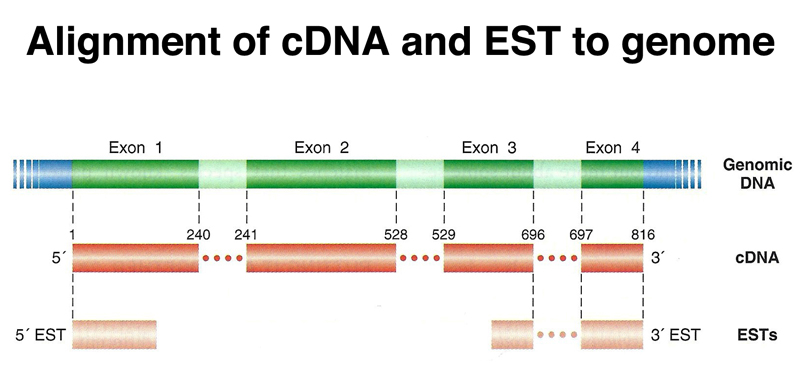
Gene expression data are very useful in gene prediction. cDNA clones and expressed sequence tags or ESTs (partial sequences derived from cDNAs) can be aligned to the genome assembly computationally to identify exons, as shown below.
Ultimately, many lines of evidence are used to refine gene models, as shown below. Experimental data from cDNA and EST sequences identify exons. Computational approaches that identify codon bias, splice sites, promoters, and other features are combined with experimental data to refine the model.
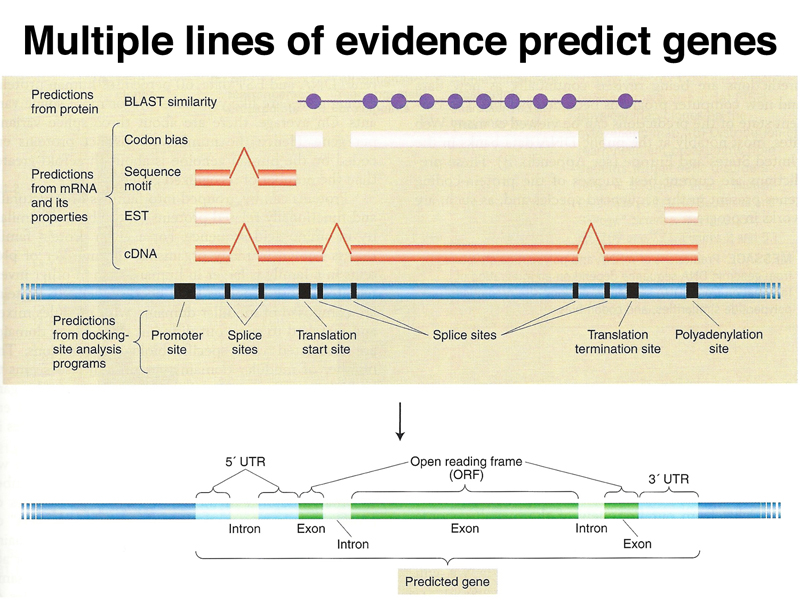
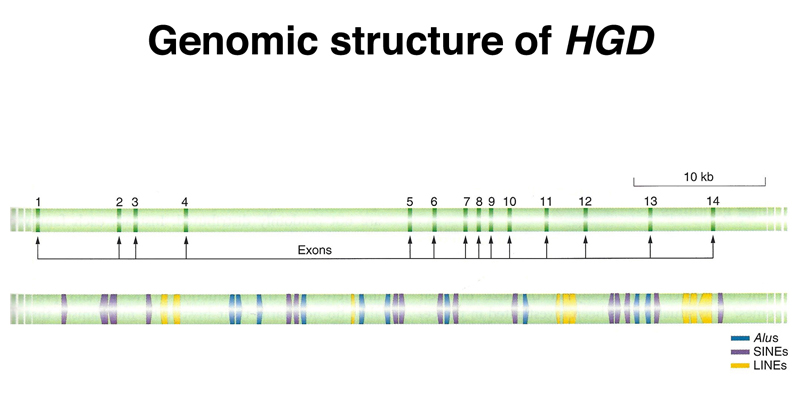
This leads to a gene model like that shown below for HGD, the gene that is mutated in alkaptonuria. Notice how small the exons are relative to the introns, and how the introns are full of interspersed repetitive sequence.
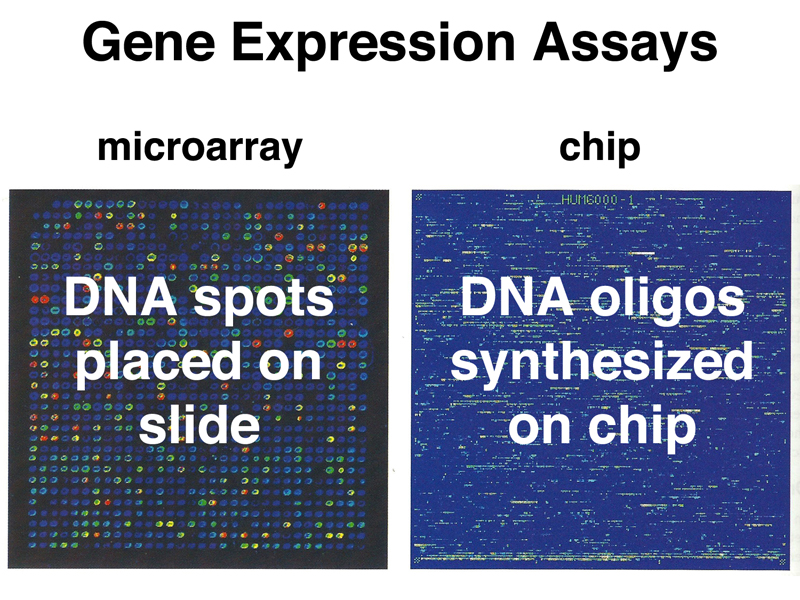
As the gene models for the human genome improved, there was an advance in technology that allowed the printing of oligonucleotide arrays using the same technique (photolithography) that is used to print integrated circuits. We have previously described the use of SNP chips for genotyping; it is also possible to manufacture chips that contain probes for all human exons. The figure below compares a microarray to a chip for analyzing gene expression.

The figure below highlights the differences between these technologies. Microarrays are spotted on microscope slides by a robot using a collection of DNAs. The microarray can be prepared from cDNA clones whose sequence need not be known. DNA chips contain spots of DNA of defined sequence that are synthesized in place on the chip. Preparation of the DNA chip requires accurate gene models and is best done in organisms with a good assembly and quality annotation (like human).
The Human Genome Project resulted in the development of high-throughput sequencing methods that have become a tool for analyzing gene expression. In 2012, the ENCODE project, a large-scale project aimed at the analysis of gene expression in the human genome, published a batch of papers and released a huge amount of data.
The figure below shows one of the key experimental techniques of the ENCODE project next to a current personal computer.
Historical Perspective: The iMac shown from 2013 has four 64-bit processors running at 3.4 GHz, up to 32 Gb of RAM, and a 2560 x 1440 LED display.
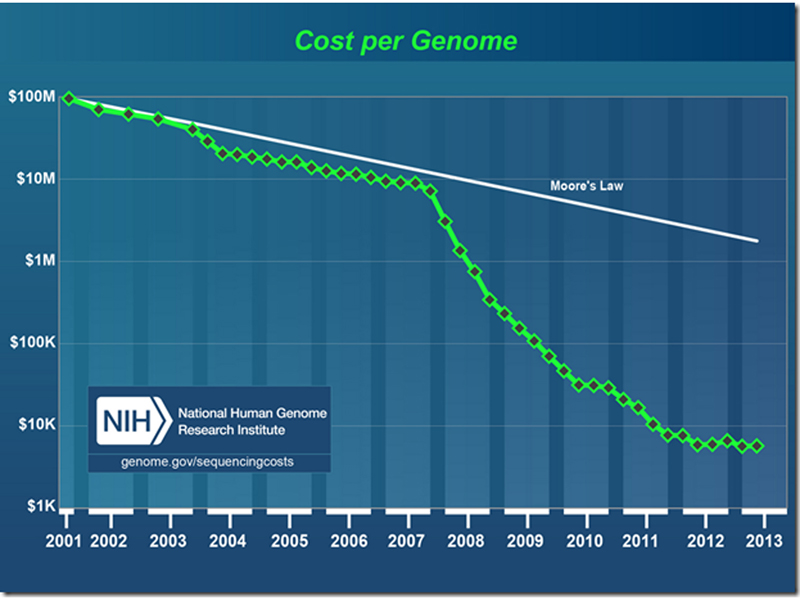
We have previously presented the collapse in the cost of the sequencing of a human genome, shown in the semilog plot below. The inflection at the end of 2007 shows the development of what is currently called "next-generation sequencing."
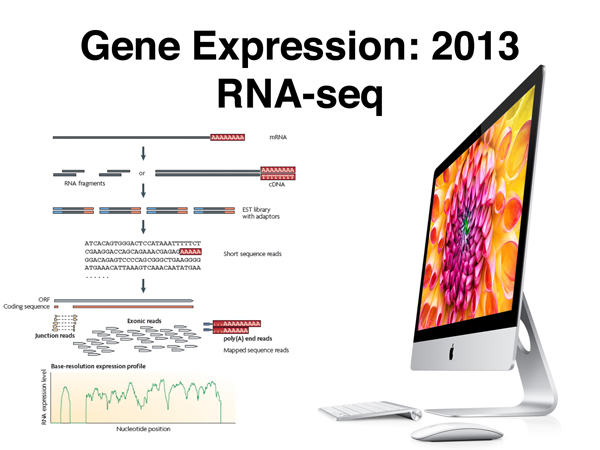
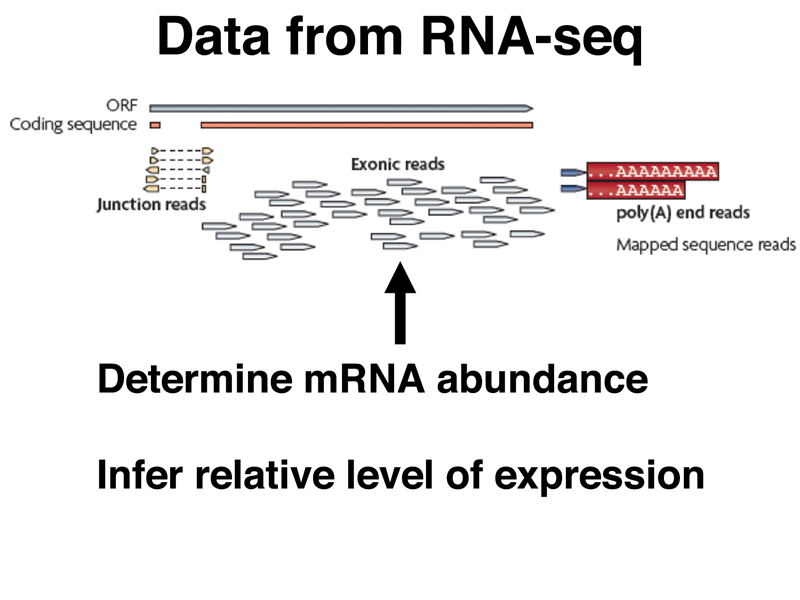
High-throughput sequencing can be used to sequence cDNA copies of all of the mRNA in a sample, as shown below. A very large number of short sequencing reads are then aligned to the genome assembly to assess the level of expression of each gene. This technique is called RNA-seq, which is shorthand for RNA sequencing.
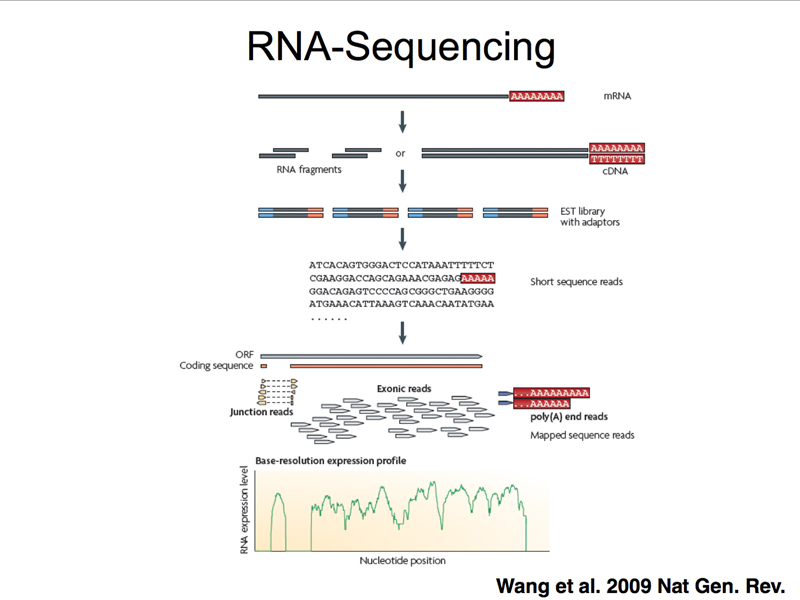
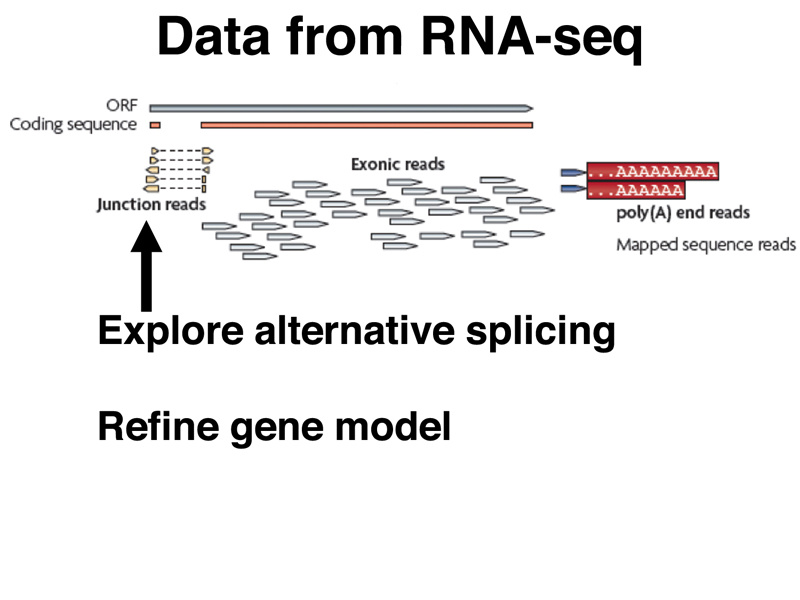
The figure below focuses on a specific aspect of data from an RNA-seq experiment. Some fraction of the sequencing reads in an RNA-seq experiment will align to non-contiguous segments of the genome. These represent "junction reads," that is, reads that span the site of a splice in mRNA. Junction reads allow us to identify sites of alternative splicing. They also allow us to refine the gene model, identifying the exact position of splices as revealed by the sequencing of mRNA.
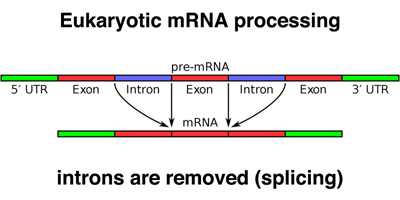
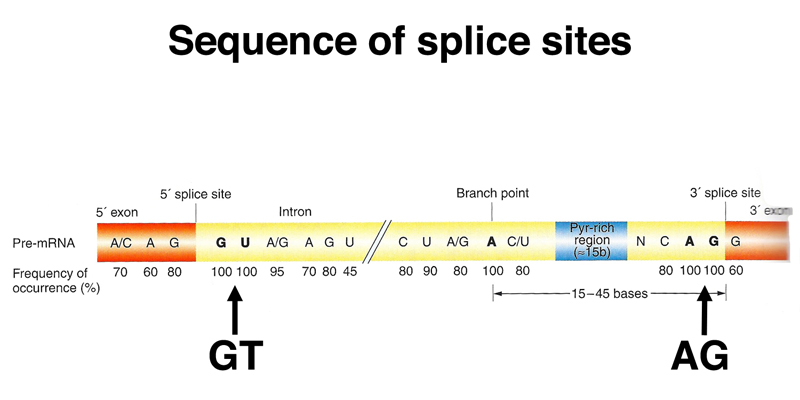
The figure below shows splicing in a simple gene. Remember, in RNA-seq, mRNA (or rather cDNA derived from it) is sequenced.
There is a minimal consensus for a splice donor and acceptor site (shown below), but many splice sites that match the consensus well are not used, and many splice sites that are poor matches to the consensus sequence are actually used. For this reason, RNA-seq data are very useful for refining gene models.
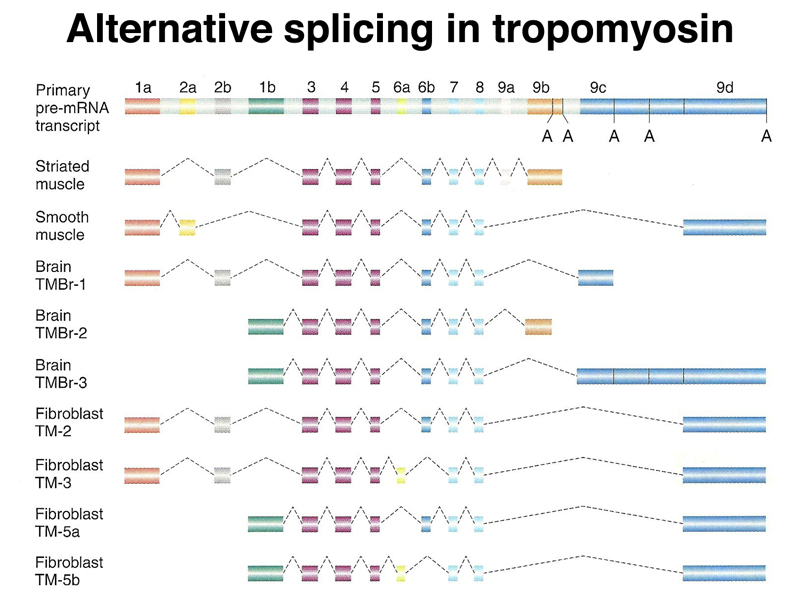
A large number of human genes (perhaps the majority) exhibit alternative splicing, producing multiple isoforms. The figure below shows alternative splicing of human tropomyosin primary transcripts. You can see that the junction fragments with a portion of some exons can be joined to different exons in different isoforms.
The other kind of read from an RNA-seq experiment is a sequence read entirely confined to a single exon, shown below. The number of reads from exons from the entire collection of reads provides information on the relative abundance of different kinds of mRNA in the sample, and is therefore a profile of gene expression.
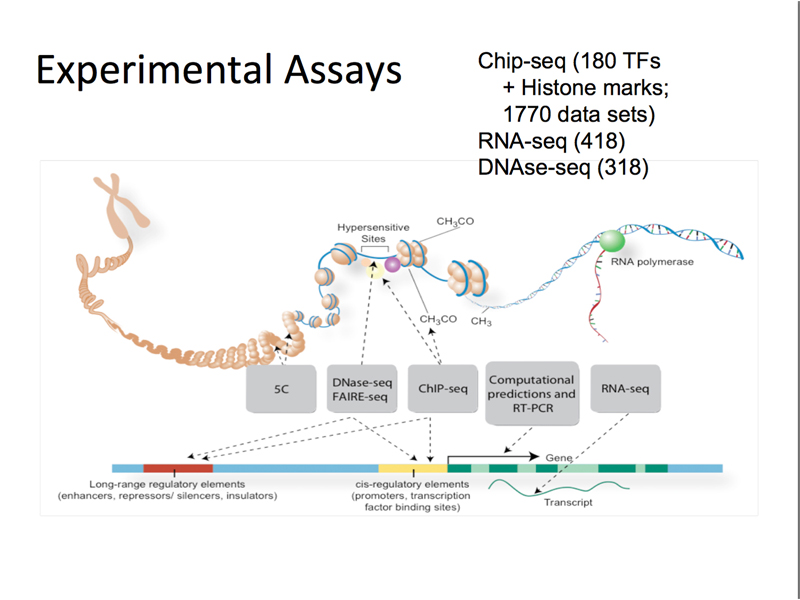
The ENCODE project is a large project using various high-throughput methods to describe all of the transcriptional units and regulatory sequences in the human genome, as well as in the genomes of selected model organisms. The figure below shows the kinds of elements associated with genes, and summarizes the techniques used to study them.
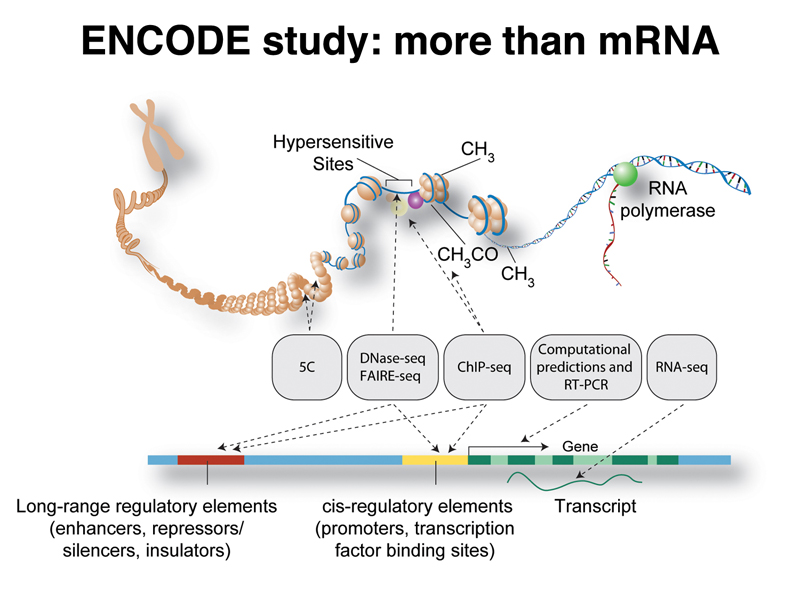
The most important techniques in the ENCODE project are summarized below.
RNA-seq. This is the sequencing of all of the mRNAs present in a cell, described above.
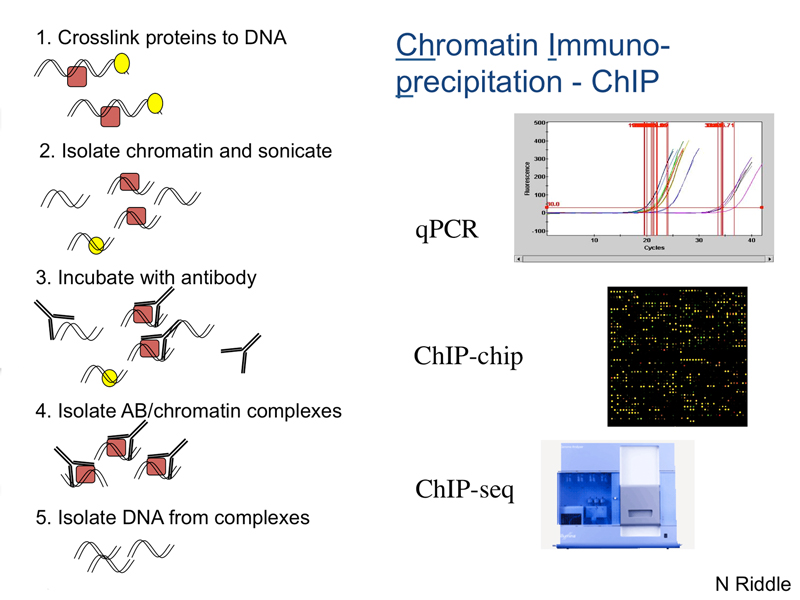
ChIP-seq. This is chromatin immunoprecipitation followed by DNA sequencing. Chromatin is treated with formaldehyde to crosslink DNA and protein. The chromatin is fragmented into small pieces by sonication. A specific antibody (to a histone modification, transcription factor, or other chromatin-associated protein) is then used to immunoprecipitate that fraction of the chromatin containing the protein. The DNA-protein crosslinks are then reversed, and the released DNA is sequenced. The sequencing reads are aligned to the genome assembly.
DNase-seq. Recall that transcription start sites that are cleared of nucleosomes are hypersensitive to DNase I. In DNase-seq, chromatin is treated with DNase I, and all of the remaining DNA is sequenced. The absence of reads corresponding to a particular part of the genome reveals a DNase-hypersensitive site. These are transcription start sites (promoters) and enhancers, regulatory elements that may be located 100 kb or more away from the promoter, that serve as binding sites for transcription factors.
FAIRE-seq. FAIRE is Formaldehyde-Assisted Identification of Regulatory Elements. Chromatin is crosslinked with formaldehyde, then extracted with phenol (which removes the protein fraction). DNA in the aqueous fraction is then sequenced. FAIRE-seq identifies regions of the genome not associated with nucleosomes, and is a sensitive method for identifying enhancer elements as well as promoters.
The figure below summarizes the ENCODE project. ChIP-seq was performed for 180 transcription factors and for histone modifications. There is a wealth of RNA-seq and DNase-seq data as well.
The cartoon below shows the principle of ChIP. DNA obtained from a chromatin immunoprecipitation may be sequenced directly (ChIP-seq) or analyzed using a genomic DNA chip (ChIP-chip).
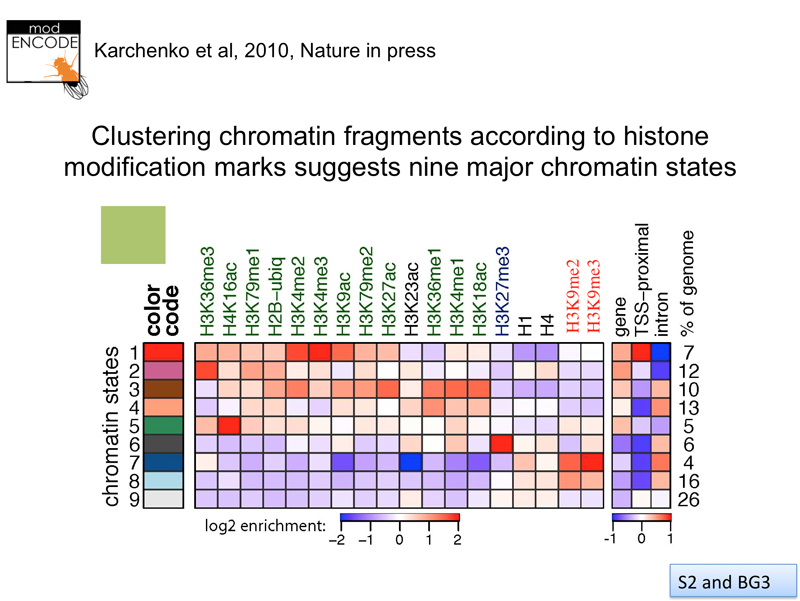
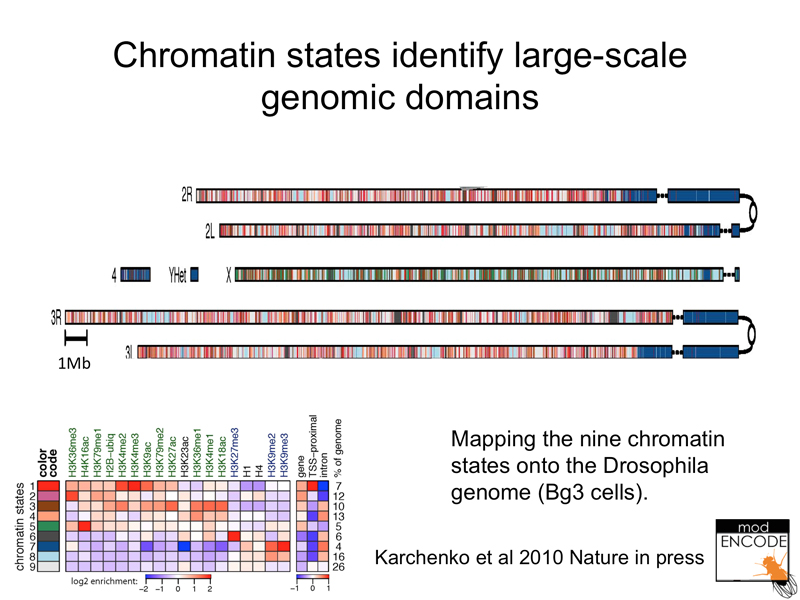
We have previously shown data from Drosophila obtained by the modENCODE project. The results of ChIP using antibodies directed against histone modifications reveals nine distinct chromatin states, as shown below.
The figure below shows chromatin states mapped against the Drosophila genome. The pericentric heterochromatin is evident as a particular state, as is the X chromosome in Drosophila males.
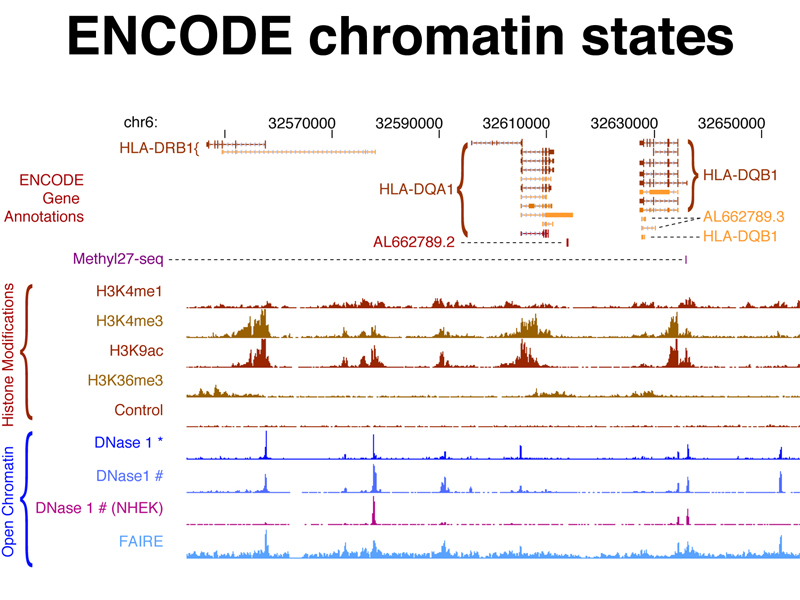
The figure below shows histone modifications as measured by ChIP-seq and open chromatin as measured by DNase hypersensitivity and FAIRE-seq against the genome coordinates of a small part of the human genome containing three genes. You can see that sites of open chromatin correspond to positions of specific histone modifications.
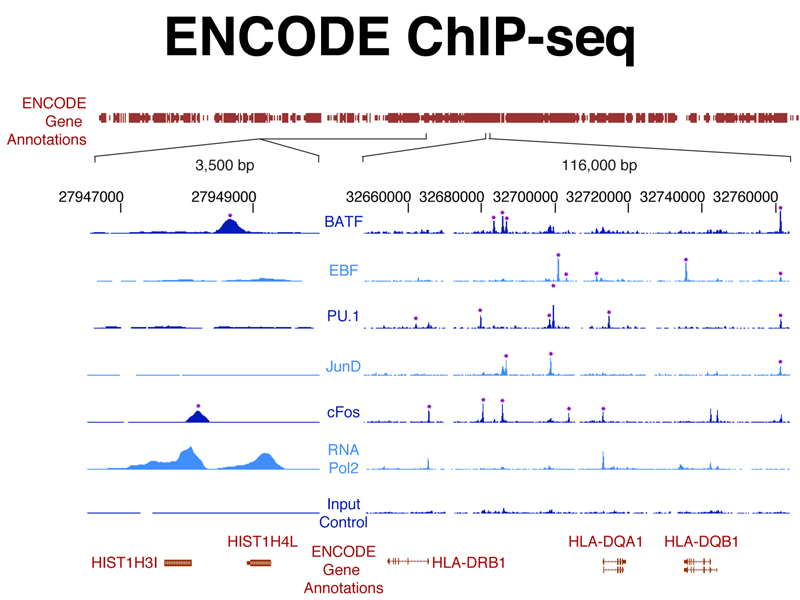
The figure below shows ChIP-seq data from experiments using antibodies to specific transcription factors against the genome coordinates of a small part of the human genome. This identifies regulatory elements that are the binding sites for specific transcription factors that control the expression of the genes shown.
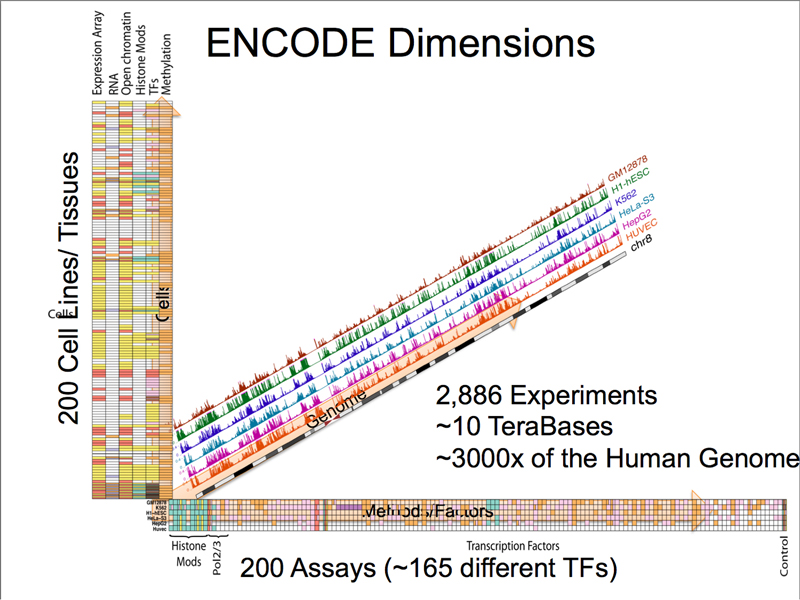
As shown below, the volume of data produced by the ENCODE project is staggering. 200 human cell lines or tissues were assayed by ChIP-seq for histone modifications, RNA polymerase, and 165 different transcription factors, generating a volume of sequence data equivalent to sequencing the human genome 3,000 times over.
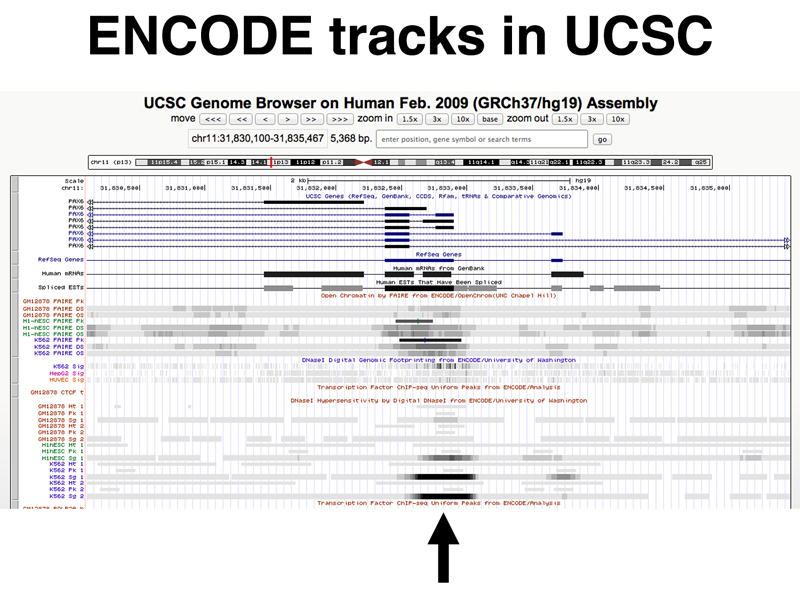
As shown in the screenshot of the UCSC browser focused on part of the human Pax6 gene, the ENCODE data can be displayed as tracks in the browser. The figure shows open chromatin (as shown by DNase hypersensitivity and FAIRE-seq) at one of the transcription start sites of Pax6.
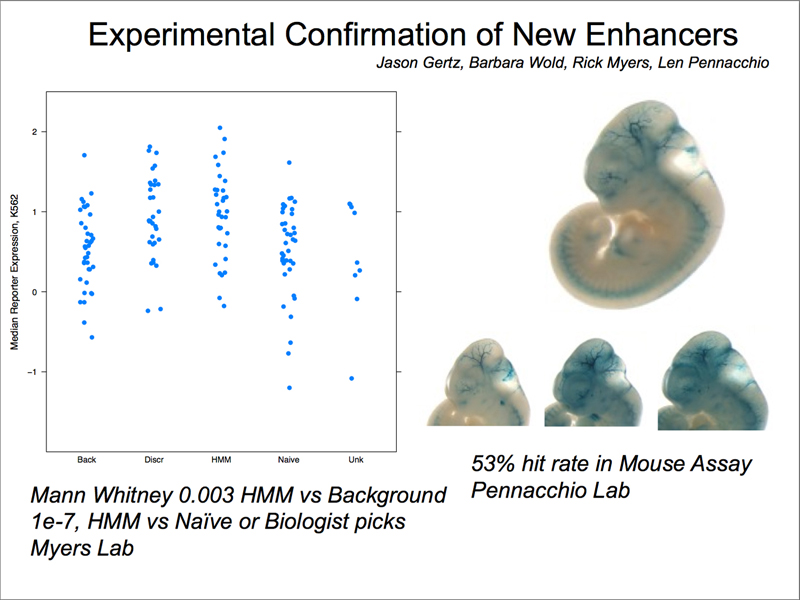
It is important to confirm whether potential regulatory elements identified by the ENCODE project are actually enhancers. As shown below, a sample of such elements was tested for their ability to drive lacZ expression in the mouse; over 50% of potential regulatory elements are validated in this assay.
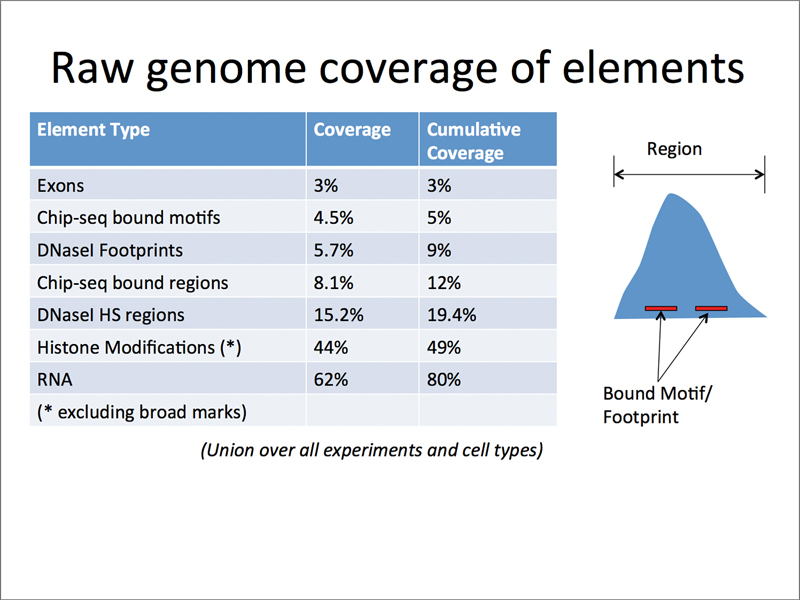
One of the big surprises of the ENCODE project is the amount of the human genome that is transcribed. The table below shows fractions of the genome and cumulative coverage for various kinds of elements. While only a minor fraction of the genome is coding, there is a larger fraction of the genome associated with regulation (ChIP-seq bound regions and DNase I hypersensitive sites). A large fraction of the genome is transcribed into noncoding RNA. The function of the bulk of this RNA is unknown, but is currently thought to be regulatory.