| Home | Syllabus | Schedule | Lecture Notes | Extras | Glossary |
| Home | Syllabus | Schedule | Lecture Notes | Extras | Glossary |
We began by acknowledging the difficulties that some students have had in getting access to MasteringBiology. Every request to extend the deadline on a Reading Quiz is something that Kelly Howe has to deal with individually, so please do not ask her to extend the deadline if you just forgot that there was a quiz. Be sure to check the schedule.
Thanks to all students affected by these difficulties for your patience. As explained on the syllabus, the big points in lecture are to be had by doing well on the exams and the final. The lowest two of your twelve Reading Exams will be dropped.
We began our discussion of heredity by asking what it is and what it isn't. In this course, heredity is the transmission of inherited characteristics from parent to offspring via sexual reproduction. Science borrows words from everyday language and applies restrictive meanings to them. When you hear the word "inheritance," you might think of money or property being passed to a son or daughter, who are after all the products of sexual reproduction. This is not true heredity, however, as an adopted child could also receive an inheritance despite not being related to his or her parents.
Consider next the language that a child learns to speak. By show of hands, it looked like over half the class had a language other than English spoken at home at least some of the time when they were growing up. If a newborn from China were to be adopted by a family in New Mexico who don't speak Chinese, the child would not grow up speaking Chinese. The language that someone learns to speak is the consequence of his or her environment, not of heredity.
We introduced the concept of quantitative traits. These are the traits that we have the most experience with from looking at our family and friends. Quantitative traits, like height, weight, percent body fat, blood pressure, and so on, exhibit a continuous range of variation. We looked at height, which shows a normal distribution for a sample of mature individuals. There aren't two kinds of people, little folk and giants, with nothing in between.
Quantitative traits are the result of interactions bewteen inherited genes and the environment. Look at the distribution of heights of Japanese men and women over the course of a century below (women in pink, men in blue).
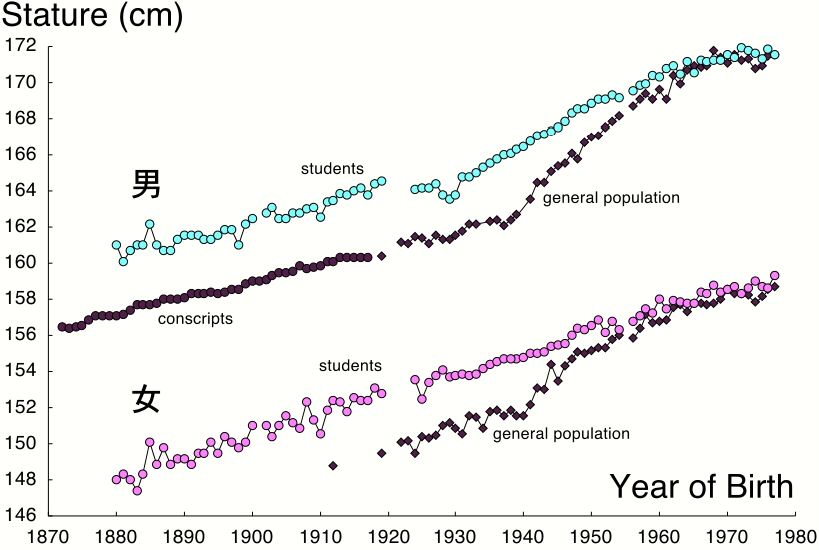
We see a steady increase in the height of Japanese men and women over the course of the century shown. Most students immediately attributed this to improvements in nutrition as Japan industrialized and experienced a rising standard of living. So we concluded that the environment affects the final outcome of your heredity, and that people who experience poor nutrition do not grow to the height that is ther genetic potential. No one was willing to say that the entire change over the course of a century could be attributed to any change in the genetic makeup of the Japanese population, although this might contribute something to the changes that we see.
We then looked at the incidence of obesity by county in the United States in 2009 in a map from the CDC, shown below.
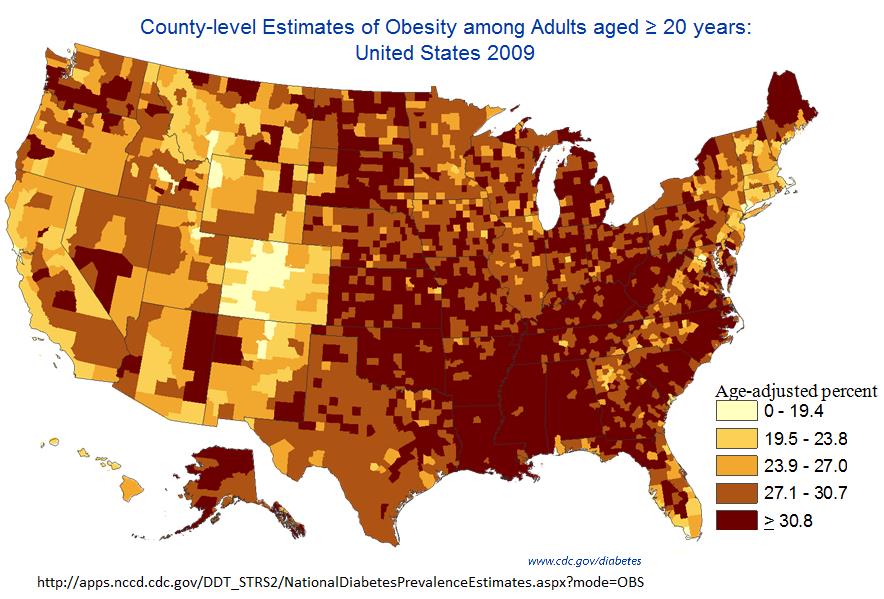
Students saw many different things in this data display. First, the data are highly structured, with no one saying that the incidence of obesity was random by county. Almost everyone observed immediately that the Southeastern United States, specifically the Mississippi delta, has the highest incidence of obesity. Most people attributed this to the environment generally, specifically a culture more accepting of obesity, lower socioeconomic status, less education, and other related factors in the Southeast.
One student though that some areas might use different standards in obesity reporting. We guessed that this would tend to show up more as a statewide rather than county-by-county problem, so we predicted that some states would stand out. Colorado looks unusual this way, and a student with specific knowledge of the situation told us that Colorado's reporting standards are indeed different.
No one was willing to attribute the entire structure of the data to this kind of error. Almost everyone agreed that the overwhelming contributor to what we see was differences in the environment. Students conceded that there might be some systematic differences in genetics in particular parts of the contry, but thought that this could not explain most of what we see.
Finally, we considered the evidence that quantitative traits are controlled by many additive factors. We started with an examination of the distribution of percent body fat on inbred strains of mice raised on a standard laboratory diet. There is a very wide spread between strains, but for any given inbred strain (derived from at least twenty generations of brother-sister matings), there is a very narrow range for this measurement. This tells us that in a standardized environment, we are best able to see genetic differences between inbred strains.
We considered what happens when two outlier strains with wide differences in a quantitative trait are crossed. Almost invariably, the measured trait in the F1 hybrids shows a mean that is about halfway between the two parents, with a wider spread. When individuals from the F2 are crossed, we see an even wider spread around the mean, with very few individuals having the extreme values shown by the two parental strains. This is the common experience of plant and animal breeders over thousands of years of civilization, so it is hardly surprising that the prevailing theories of inheritance before Mendel were about blending inheritance, with some vaguely defined fluid component of each parent contributing to the characteristics of the offspring.
We also examined the estimate of my chances of coronary heart disease from the analysis of my genome at 23andMe, shown below.
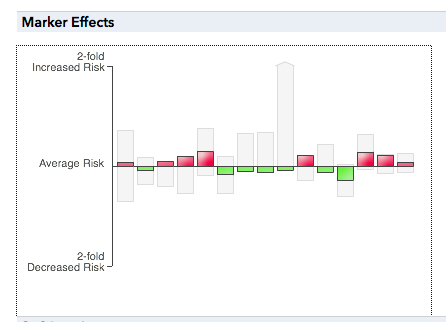
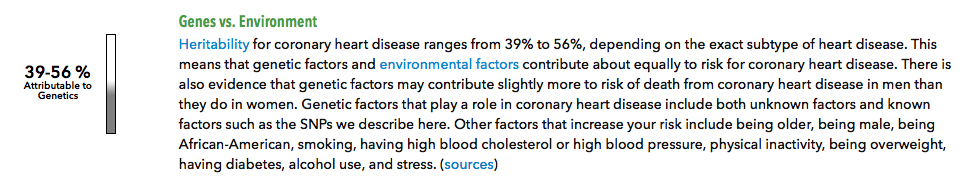
Without delving too deeply into how we know all of this, we can see that the current analysis includes my genotype at each of fifteen different risk genes. It is no surprise to see that I, likely an average person with respect to this trait, have about as many factors that slightly increase my risk of disease as those that lower it. We also saw that about 45 - 60% of my risk was due to environmental factors, which everyone was quickly able to enumerate: diet, exercise, body mass index, status as a smoker or nonsmoker, and exposure to stress.
The points to remember from this introduction to quantitative traits are these:
These points, and this approach to introducing heredity, are taken from Dougherty (2009) Closing the Gap: Inverting the Genetics Curriculum to Ensure an Informed Public Am J Hum Genet. 85: 6-12.
Mendel's major contribution to the science of genetics was to carefully select the traits that he chose to study. He looked for traits in which the progeny of two true-breeding lines completely resembled one of the two parents. His traits also seem refractory to influence by the environment or by other genes. In this way, he could concentrate on the mechanism by which hereditary units were transmitted, rather than attempting to study how genes controlled specific traits.
We decided to make it easier on ourselves by taking something that we understood well: albinism. We looked at photos of albino hedgehogs, kangaroos, koalas, squirrels, peacocks, vultures, turtles, and salamanders. We could see that pink-eyed albinos entirely lack the pigment melanin, and accepted that there isn't any environmental difference that could partially restore their color. We saw a human family that included three albinos among five children.
Albinism is the result of a lack of the enzyme tyrosine hyroxylase, which converts the amino acid tyrosine to DOPA (dihydroxyphenylalanine).
Albino mice are available, so we decided to replicate Mendel's experiments with two highly inbred strains of mice, one albino and one black. These strains are true-breeding with respect to every trait when crossed within the strain.
In the cross of true-breeding black mice to true-breeding albinos, we get an F1 that is all black. When we cross members of the F1 generation to each other, we get some black and some white. The reappearance of the albino trait in the F2 progeny shows that blending inheritance is not correct for this trait. The albinos of the F2 exactly resemble the albinos of the true-breeding albino line. There is not the slightest trace of pigment in any of these animals.
Mendel also counted all of his progeny. The F2 ratios were always close to 3:1, with the dominant allele (the one shown in the hybrid) always in the majority. What does this ratio mean?
It is helpful to consider the results of a testcross, the cross of an individual to the true-breeding line carrying the recessive allele. From crosses like this, we can see that there are only two kinds of black mice: those that produce 100% black mice when crossed to an albino, and those that produce black and albino in equal proportion (a 1:1 ratio). There aren't any other kinds of black mice, nor indeed are there any yellow, grey, beige, or brown mice.
With this in mind, we examine the black mice from the F2. We can see in testcrosses that there are two kinds of black mice here: those that produce only black mice when crossed to albino, and those that produce a 1:1 ratio of black to albino. The ratio of true-breeding black to hybrids among the black mice of the F2 is 1:2, so the 3:1 ratio of black to albino is actually a 1:2:1 ratio of true-breeding black: hybrid black: albino.
We asked the class to consider the mathematical meaning of the 1:2:1 ratio. After some fumbling, we arrived at the conclusion that Mendel (who trained under the physicist Doppler) certainly recognized: these are the coefficients of a binomial expansion, the third line of Pascal's triangle.
This inevitably takes us to the study of probability, which we defined. The probability of an event is the likelihood of that event, expressed as a frequency. In the familiar case of a coin toss, the probability of heads on a single coin toss is 0.5, and the probability of tails on a single coin toss is 0.5.
We considered the problem of tossing two coins at the same time, first solved by the mathematician Jean le Rond d'Alembert in the sixteenth century. Alembert reasoned that since there were three outcomes (two heads, one head, and no heads), the likelihood of any one of these outcomes was 1/3.
Alembert was distinguished in his work both by being first to offer a solution and also by offering the incorrect one. Before I was able to win any money from anyone with a sucker bet on one head in the toss of two coins at 2:1 odds, an alert student pointed out that this solution was not correct, and that the probability of two heads is 1/4, the probability of two tails is 1/4, and the probability of one head and one tail is 1/2, as shown in the figure below.
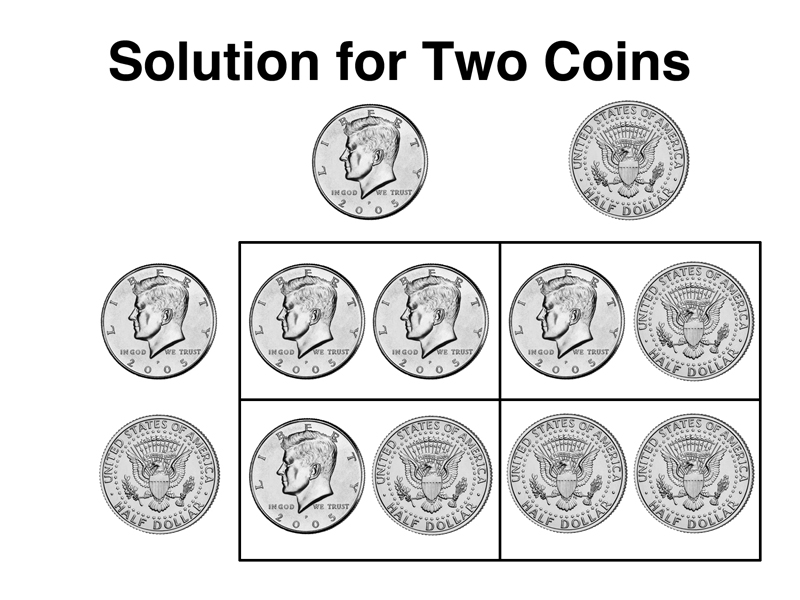
In studying this figure, consider that if the coins had different dates, we could tell apart the two ways that there are to get one head and one tail. This was the correct solution arrived at by scholar and rogue Cardino in the fifteenth century, whose book on the subject was not published until 100 years after it was written, not due to editorial difficulties but rather due to Cardino's practice of deriving considerable income by setting up sucker bets against marks; he didn't want to endanger his income by allowing the public to calculate odds correctly.
The figure is a visual illustration of the Product Rule: The probability of two independent events occurring simultaneously is the product of their individual probabilities. Thus the toss of two heads comes up 1/2 x 1/2 or 1/4 of the time. It is vital to understand the concept of independence. The probability of getting heads on a coin toss is 1/2. The probability of getting heads on the next coin toss after the coin has come up tails three times is also 1/2. The coin cannot remember what it did, and two coins tossed at the same time don't talk to each other. Failure by the general public to grasp this principle allows casinos to stay in business.
We can also use the figure to help us ask a more difficult question: what is the probability of getting one or two heads on a toss of two coins? This is an opportunity to use the Sum Rule: The probability of either of two mutually exclusive events is the sum of their individual probabilities. We mean by "mutually exclusive" that we will get one event or the other, but not both, in one trial. In a single coin toss, the mutually exclusive events are heads and tails, each with a probability of 1/2, so the using the Sum Rule, 1/2 + 1/2 = 1, so we are certain to get a head or a tail on the toss of a single coin. When we toss two coins, the probability that we will get one or two heads is 1/4 + 1/2 = 3/4. This is evident from the figure.
Interestingly, the probability of getting one or two heads (3/4) means that the ratio of paired coin tosses that give at least one head to those that give no heads is 3:1, which takes us back to Mendelism.
We left as an exercise to the student working out the sample space for a roll of a pair of six-sided dice. Each die can generate six numbers, so the sample space is a 6 x 6 grid with 36 possibilities.
We now have everything that we need to understand the monohybrid cross. One of the most informative experiments that we have described is the results of the testcross of an F1 hybrid from the cross of true-breeding black mice to true-breeding albinos. In the testcross, the F1 hybrid produces a 1:1 ratio of black to albino. This means that inside the hybrid is a coin-tossing machine of some kind that delivers the albino allele of the tyrosinase gene to half of the gametes, and the normal allele of the tyrosinase gene to the other half of the gametes. If we call the normal allele A and the albino allele a, we can label the crosses that we presented earlier as shown below.
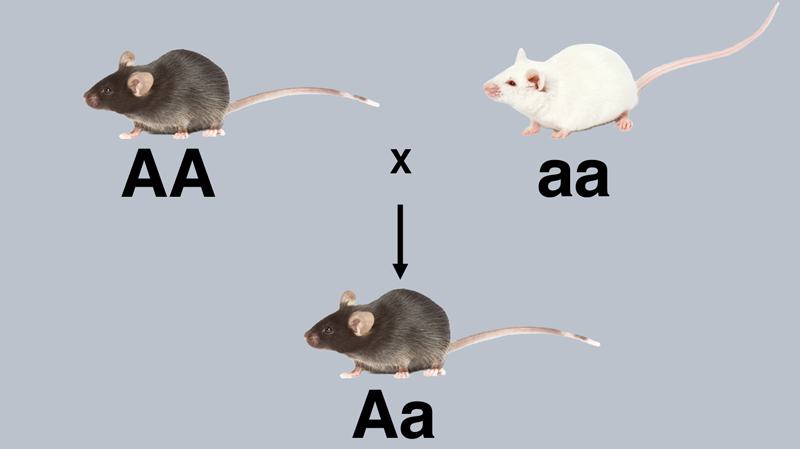
The cross above is the original cross of true-breeding black (AA) to true-breeding albino (aa). All of the offspring are black hybrids (Aa).
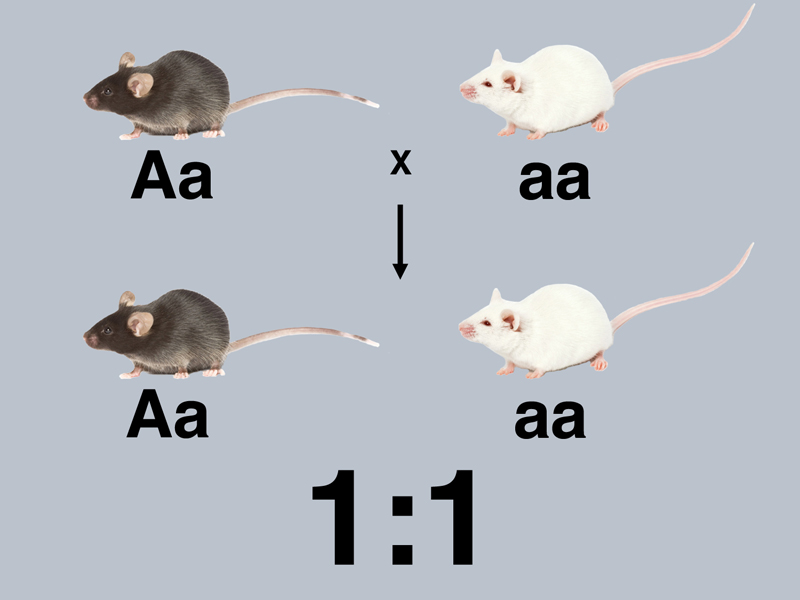
The cross above is the testcross of a black mouse, in this case an F1 hybrid (Aa), to the true-breeding albino (aa). This produces a 1:1 ratio of black to albino among the progeny, a demonstration that the hybrid produces two kinds of gametes with equal frequency.
We know that there is another possible outcome of the testcross of a black mouse: the one shown in the first picture, where a black mouse produces only black hybrids in a testcross to an albino. There are no other kinds of black mice with respect to the testcross. It's either all black offspring, or a 1:1 ratio of black to albino.
Because the original true-breeding black (AA) and albino (aa) mice make only one kind of gamete (and hence one kind of zygote), we call them homozygous. Because the hybrids (Aa) make two kinds of gametes (and hence two kinds of zygotes), we call them heterozygotes.
The intercross of the F1 hybrids to produce the 3:1 and 1:2:1 ratio (inferred from testcross results) are shown below, with all mice labeled with respect to their genotype.
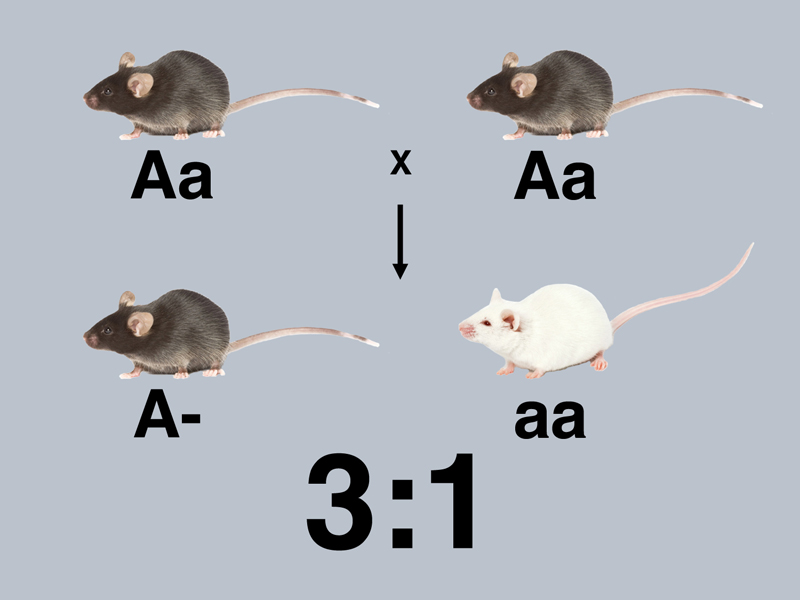
In the cross above, we cannot distinguish true-breeding black (AA) from hybrids (Aa) among the black mice in the F2, so we label all of the black mice as A- (at least one A allele). There is a 3:1 ratio of black to albino in the F2.
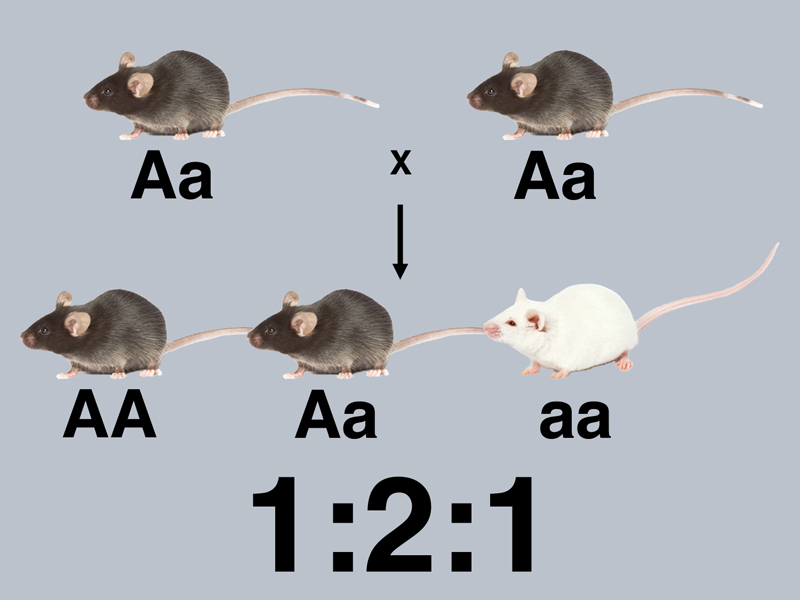
The results of the testcrosses show that there are both homozygotes (AA) and heterozygotes (Aa) among the black mice of the F2. There are twice as many Aa as AA, giving us a 1:2:1 ratio of AA:Aa:aa.
This brings us to Mendel's First Law, the principle of segregation, which states that the two different alleles of a gene segregate into different gametes.
Because we have previously discussed meiosis, we also know that the two different chromosomes of a homologous pair segregate into gametes. Gametes will have one chromosome or the other. We saw in the prior lecture that chromosomes can have a profound effect on development, so we suspect that genes are on chromosomes, although we have not yet proven that.
Albinism. We looked again at a photo of human albinos, then at a photo of a human albino living in equatorial Africa with skin cancer. Skin cancer is common among albinos that are exposed to a lot of sunlight. Dark skin protects us against sun exposure. So how do we account for light-skinned people?
If we look at human populations perhaps 500 years ago before widespread global travel, we see that populations in Northern Europe have light skin. When we are exposed to sunlight, we make vitamin D. A deficiency of vitamin D causes rickets, a disorder almost unknown today that affects bone development. Women with rickets tend to die during childbirth. People with dark skin do not make as much vitamin D as people with light skin when exposed to the same amount of sunlight.
This means that while it is great to have dark skin when living near the equator (you are, after all, protected from skin cancer), it is better to have light skin when living in far Northern latitudes where there isn't much sunlight, so that you can make as much vitamin D as possible on those rare occasions when the sun is out (skin cancer isn't much of a risk). It is interesting to consider that skin color, over which such a great deal of fuss has been made by people who don't understand biology, is really just about avoiding skin cancer and rickets depending on where your ancestors lived.
There are many alleles of many genes that together give you your skin color; it is a quantitive trait, even though there is a Mendelian variant (albino) with a very large effect that is not influenced by any of these other factors.
You can read more about albinism at OMIM.
Phenylketonuria (PKU). Phenylketonuria is an inborn error of metabolism resulting from loss of the enzyme activity phenylalanine hydroxylase. Phenylalanine hydroxylase converts the amino acid phenylalanine into the amino acid tyrosine. In the absence of this enzyme activity, affected individuals show very high levels of phenylalanine (and its keto acid, derived from transamination) in their blood and urine. For reasons that are not entirely understood, this has a devastating effect on brain development. Without intervention, affected individuals lose 70 IQ points in the first two years. Fortunately, there is a highly effective treatment, a synthetic diet low in phenylalanine that allows normal development to occur.
Because there is a treatment, and because failure to administer the treatment has devastating consequences, there was a great need to develop a screening test. Dr. Robert Guthrie, a physician who had a son with PKU, developed a cheap and easy newborn screening test in the 1950s that was quickly adopted everywhere, becoming the first genetic screeen applied to newborns.
In the Guthrie test, a few drops of blood are collected from a newborn by pricking their heel and collecting the blood on paper. The paper spots are placed on a plate of minimal agar medium that has been spread with bacteria (E. coli) that are phenylalanine auxotrophs (they can't make phenylalanine). There is no phenylalanine in the agar medium, so the bacteria must get it from the paper spot to grow. Blood spots with a normal amount of phenylalanine show a small circle of growth around them, while blood spots with a lot of phenylalanine (PKU patients) show a large circle of growth.
You can read more about PKU at OMIM.
Huntington Disease. We briefly discussed Huntington Disease, an inherited neurological disorder that typically strikes people in the fifth decade of life. They experience involuntary rhythmic movements and eventually become completely immobile, dying over the course of several years. The folk singer Woody Guthrie, who wrote "This Land is Your Land," died of the disease. His son Arlo Guthrie is also a folk singer known for "Alice's Restaurant." Because the symptoms appear later in life, most people have already had their children before they learn of their status. There is now a genetic test for Huntington Disease.
We raise Huntington Disease to show that not all dominant alleles are common, and that not all dominant alleles are better than the recessive alleles. Furthermore, it only makes sense to talk about dominant and recessive when we are comparing two specific alleles, and should be very careful to consider what trait we are discussing.
You can read more about Huntington Disease at OMIM. There is also a terrific video on Huntington Disease from the Genomes, Environments, and Traits 2013 conference.
Human Pedigrees. We then learned how to read human pedigrees and infer genotypes from the results shown. In human pedigrees, men are indicated by squares and women are indicated by circles. Open circles are normal individuals, while filled circles are affected individuals.
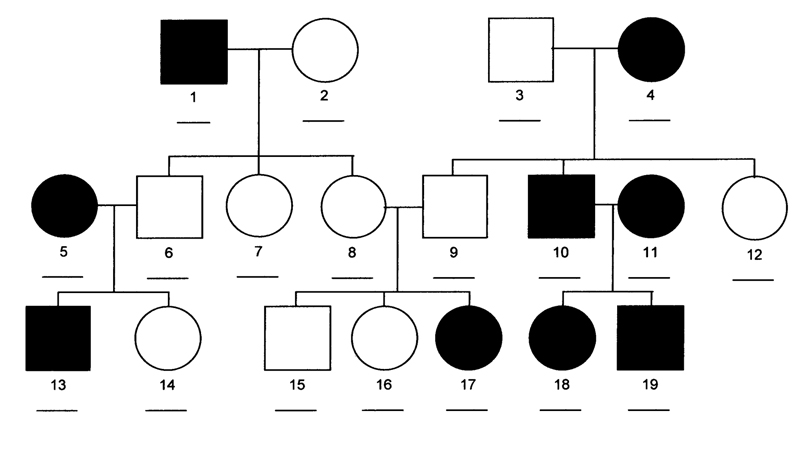
This version of the pedigree above is not labeled with respect to genotype. We begin to solve this pedigree by considering individual 2. One student guessed that she was AA, but with a sample of only three offspring, we can't be sure. The probability of three A- offspring from the aa x Aa cross is 1/2 x 1/2 x 1/2 = 1/8.
We then considered individual 6. She must be Aa, because in a cross to aa, she had an aa child. This means that her siblings are all Aa, because her father (individual 1) is aa. One of her siblings (individual 8) has children by individual 9, with one affected child. This means that they are both Aa. We can't tell whether their unaffected children (15 and 16) are AA or Aa.
We know that individual 3 must be Aa (he has aa children in a cross to aa). All of their unaffected children (9 and 12) must be Aa.
You should study this pedigree carefully to see how the reasoning works. The pedigree has genotypes filled in for all individuals where that can be known below.
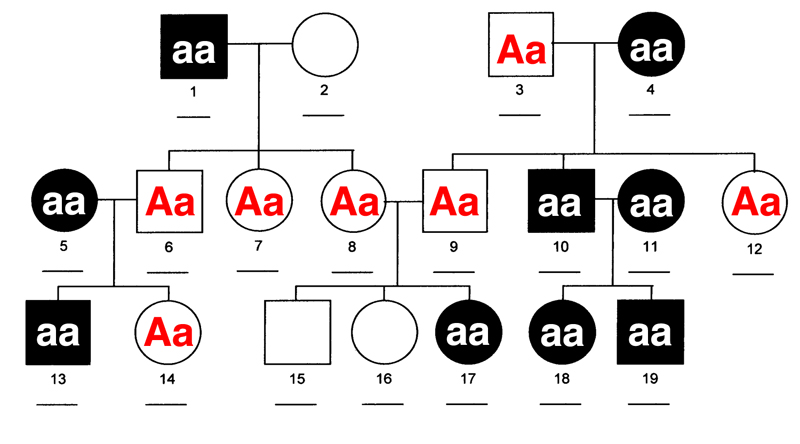
We have solved this pedigree after first concluding that the condition was an autosomal recessive. We can see that the condition is recessive because individual 17 has two unaffected parents.
We also solved a pedigree for Huntington Disease, a dominant disorder. In this case, we knew that the disease was rare, so we could assume that anyone marrying into the family from the outside was almost certainly genotypically normal. We saw affected individuals from a cross of an affected individual to an unaffected person from outside the family, indicating a dominant disorder.