GENSCAN predicts a single protein from this genomic sequence:
>/tmp/01_15_13-09:49:42.fasta|GENSCAN_predicted_peptide_1|1120_aa
MAVCVGSHCRSGNVRVVNGNVKRLLYRNETIPLDECAAGNLSGQLEFKWNATYNVIAMRN
LPCLGTAGGSGLGGIAGKPSPTMEAVEASTASHPHSTSSYFATTYYHLTDDECHSGVNQL
GGVFVGGRPLPDSTRQKIVELAHSGARPCDISRILQVSNGCFFLIIDVLPCRNPVGVVTV
VVALKSPFDSSSRGSTDSSALTGQAVWVRIKSFHIFFGDVLELLSEFGGLEIAFEKFFLG
SSSVEPGSYLGDFLQQWRASISESRRTGWGQCGLAVKRQFVVWSNKPGHSSYLPIEGYTK
VFIRLVVVDRFTIKADTRTTTCHIGTLFSSSSGSQPIHPVIRPREQTLYLCFSHSSIVSL
GGYGDIFFLYSCDWYYETGSIRPRAIGGSKPRVATAEVVSKISQYKRECPSIFAWEIRDR
LLQENVCTNDNIPSVSSINRVLRNLAAQKEQQSTGSGSSSTSAGNSISAKVSVSIGGNVS
NVASGSRGTLSSSTDLMQTATPLNSSESGGASNSGEGSEQEAIYEKLRLLNTQHAAGPGP
LEPARAAPLVGQSPNHLGTRSSHPQLVHGNHQALQQHQQQSWPPRHYSGSWYPTSLSEIP
ISSAPNIASVTAYASGPSLAHSLSPPNDIESLASIGHQRNCPVATEDIHLKKELDGHQSD
ETGSGEGENSNGGASNIGNTEDDQARLILKRKLQRNRTSFTNDQIDSLEKEFERTHYPDV
FARERLAGKIGLPEARIQVWFSNRRAKWRREEKLRNQRRTPNSTGASATSSSTSATASLT
DSPNSLSACSSLLSGSAGGPSVSTINGLSSPSTLSTNVNAPTLGAGIDSSESPTPIPHIR
PSCTSDNDNGRQSEDCRRVCSPCPLGVGGHQNTHHIQSNGHAQGHALVPAISPRLNFNSG
SFGAMYSNMHHTALSMSDSYGAVTPIPSFNHSAVGPLAPPSPIPQQGDLTPSSLYPCHMT
LRPPPMAPAHHHIVPGDGGRPAGVGLGSGQSANLGASCSGSGYEVLSAYALPPPPMASSS
AADSSFSAASSASANVTPHHTIAQESCPSPCSSASHFGVAHSSGFSSDPISPAVSSYAHM
SYNYASSANTMTPSSASGTSAHVAPGKQQFFASCFYSPWV
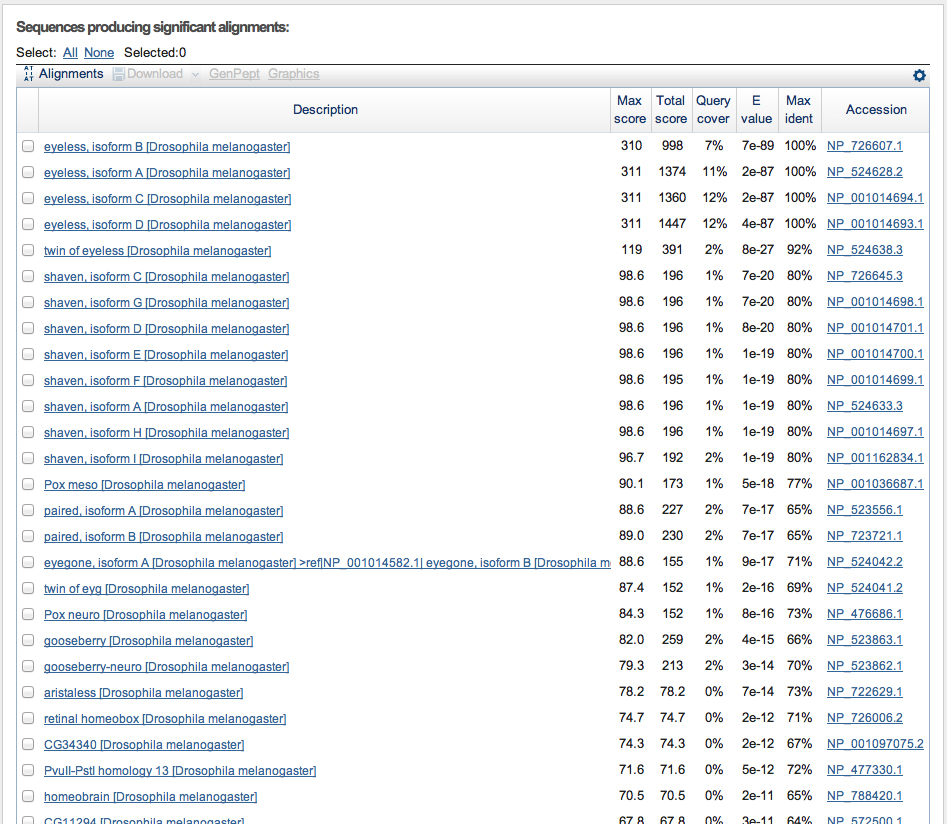
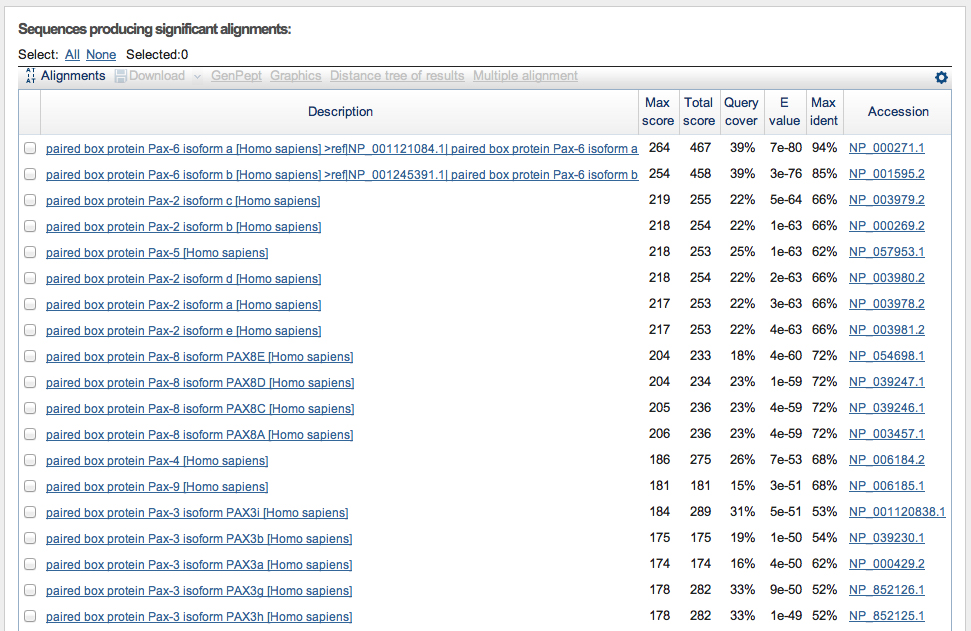
Performing a BLASTX search of the genomic sequence as described in the exercise produces top hits as shown in the screen shot below.
Look at the column showing E values.
Notice that there is a break in the scores after the first four hits. The E value rises from 4e-87 for the last of the eyeless isoforms to 8e-27 for the next protein, encoded by the twin of eyeless gene. There is a long tail of significant hits following. These are all genes related to eyeless by protein sequence similarity.
We are going to make a hypothesis here, that only the four eyeless isoforms are encoded by the genomic segment that we used as a query sequence. How would you test this hypothesis?
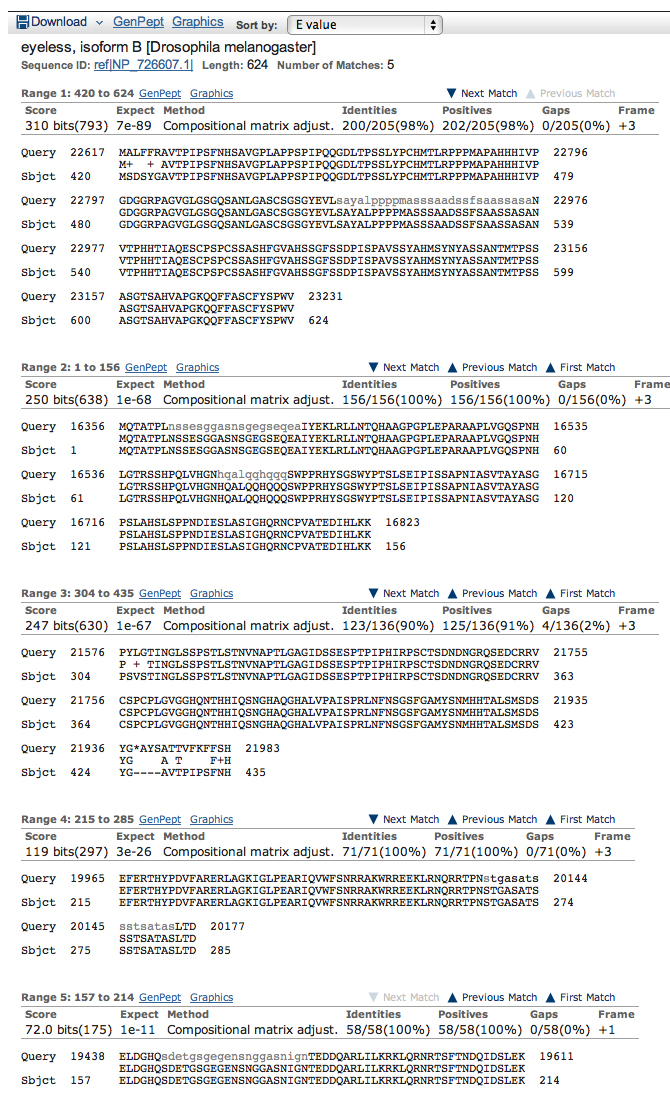
Here is the alignment for the top hit, isoform B encoded by eyeless. Notice that there are five segments that align. Remember that we are using a six-frame translation of the query DNA sequence, so the coordinates on the query sequence don't correspond to amino acid positions in a predicted protein. The subject sequence coordinates are informative, however.
Make a model of isoform B of eyeless using only these alignments. Is this model realistic? The most important questions here are:
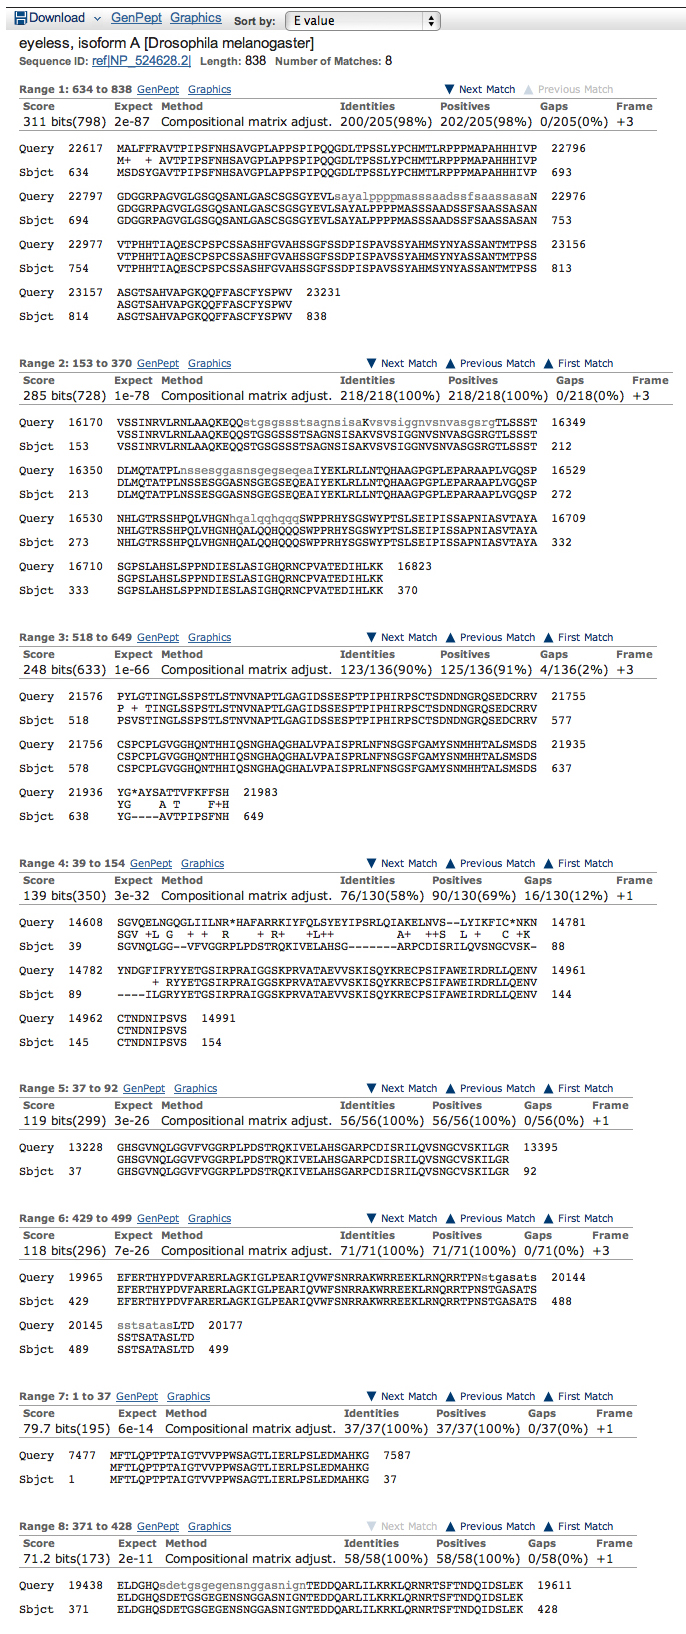
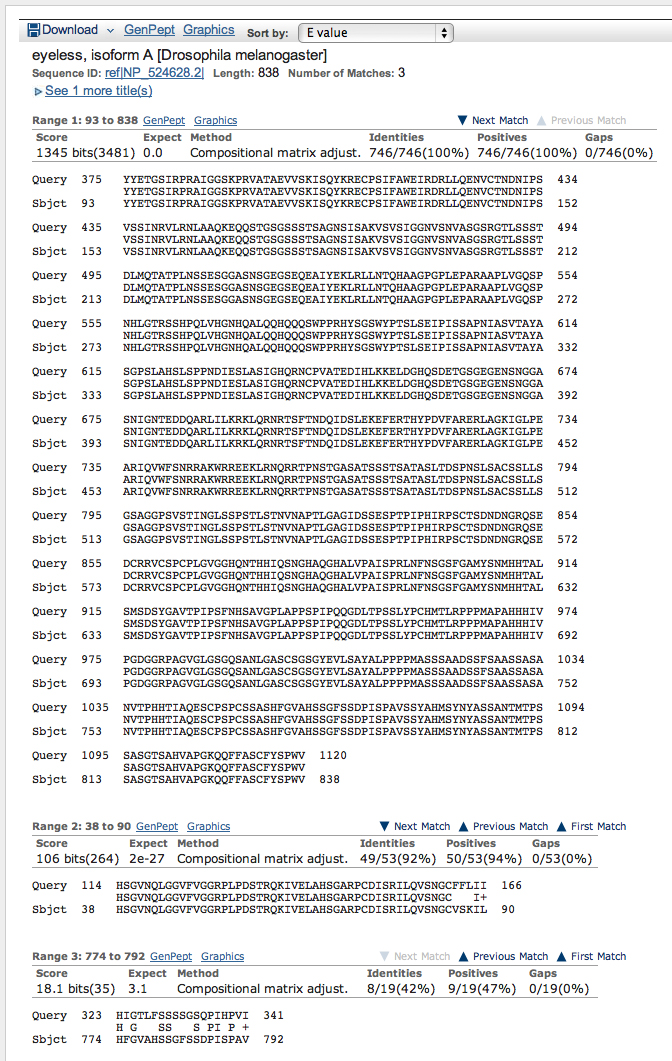
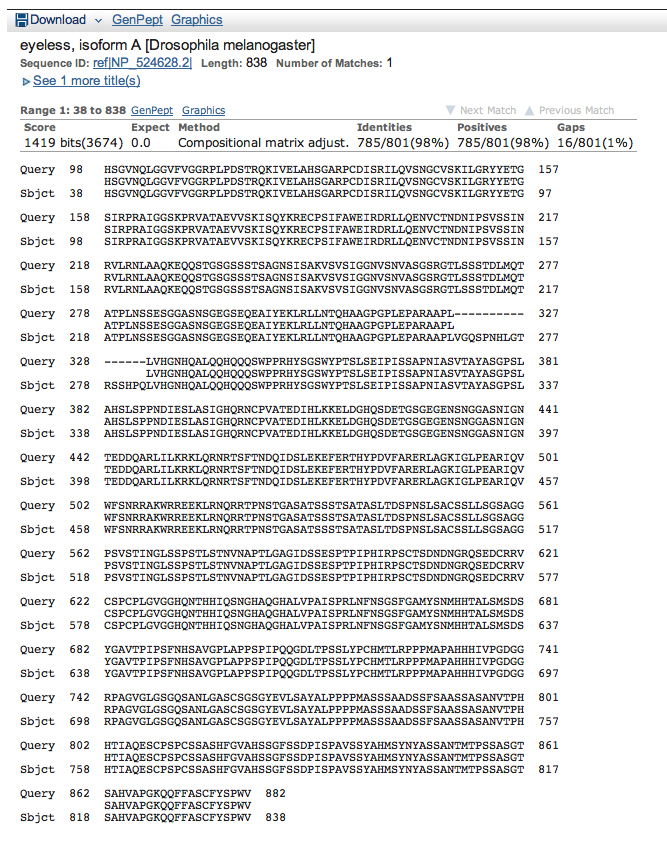
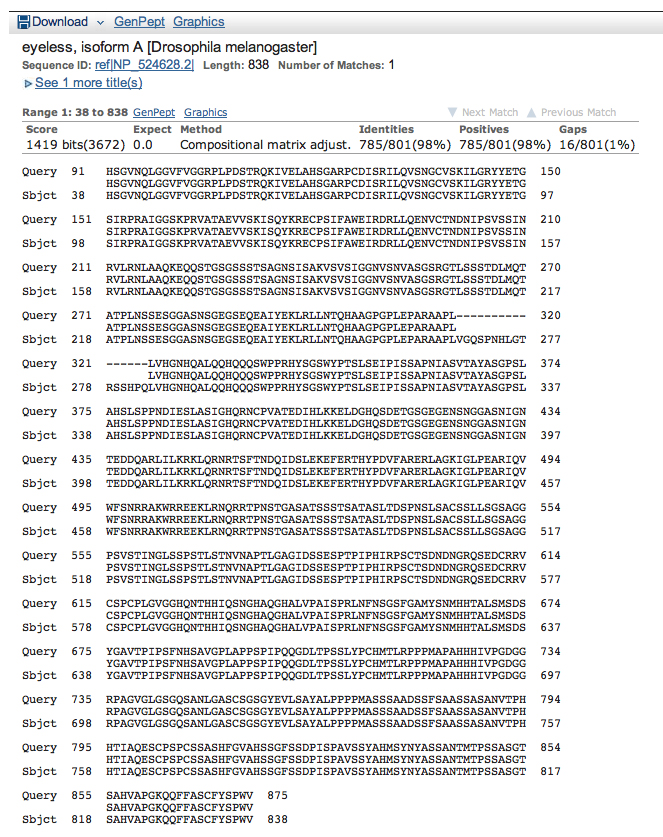
Here is the alignment for the next hit, isoform A encoded by eyeless.
Make a model of isoform A of eyeless using only these alignments. Is this model realistic? The most important questions here are:
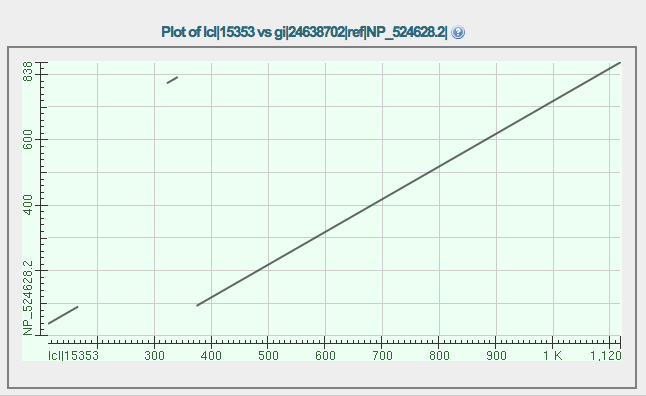
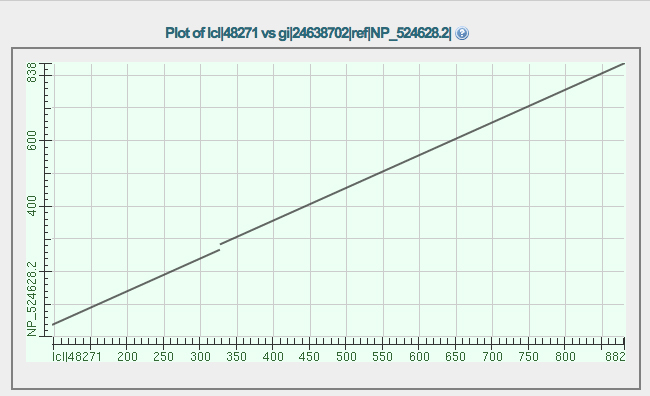
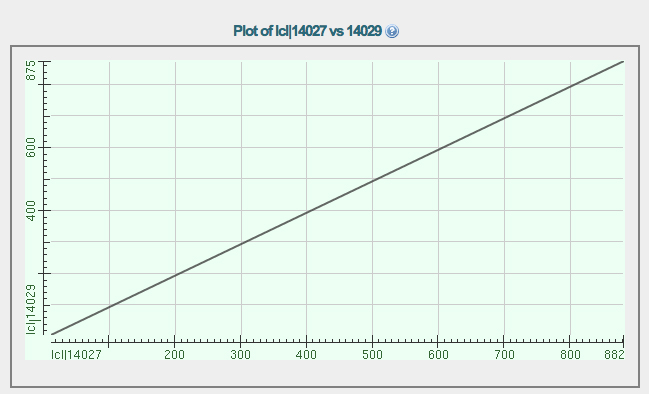
The dot plot comparison of the GENSCAN protein (X axis) vs. isoform A of eyeless (Y axis) is shown below. Notice that there are three segments that align.
Why is there a break in the diagonal line? Consider the two longest alignments. What is the meaning of the gap along the X axis when considering these two alignments?
The shortest alignment represents a segment near the end of the protein on the Y axis. Notice that this same segment is also represented in the longest alignment. How do you explain this?
The aligned sequences are presented below the dot plot.
Augustus (when set to Drosophila melanogaster) predicts two very similar proteins from this genomic sequence:
>Augustus_prediction1
MFTLQPTPTAIGTVVPPWSAGTLIERLPSLEDMAHKDNVIAMRNLPCLGTAGGSGLGGIAGKPSPTMEAVEASTASHP
HSTSSYFATTYYHLTDDECHSGVNQLGGVFVGGRPLPDSTRQKIVELAHSGARPCDISRILQVSNGCVSKILGRYYETGSIRPRAIGGSKPRVATAEV
VSKISQYKRECPSIFAWEIRDRLLQENVCTNDNIPSVSSINRVLRNLAAQKEQQSTGSGSSSTSAGNSISAKVSVSIGGNVSNVASGSRGTLSSSTDL
MQTATPLNSSESGGASNSGEGSEQEAIYEKLRLLNTQHAAGPGPLEPARAAPLLVHGNHQALQQHQQQSWPPRHYSGSWYPTSLSEIPISSAPNIASV
TAYASGPSLAHSLSPPNDIESLASIGHQRNCPVATEDIHLKKELDGHQSDETGSGEGENSNGGASNIGNTEDDQARLILKRKLQRNRTSFTNDQIDSL
EKEFERTHYPDVFARERLAGKIGLPEARIQVWFSNRRAKWRREEKLRNQRRTPNSTGASATSSSTSATASLTDSPNSLSACSSLLSGSAGGPSVSTIN
GLSSPSTLSTNVNAPTLGAGIDSSESPTPIPHIRPSCTSDNDNGRQSEDCRRVCSPCPLGVGGHQNTHHIQSNGHAQGHALVPAISPRLNFNSGSFGA
MYSNMHHTALSMSDSYGAVTPIPSFNHSAVGPLAPPSPIPQQGDLTPSSLYPCHMTLRPPPMAPAHHHIVPGDGGRPAGVGLGSGQSANLGASCSGSG
YEVLSAYALPPPPMASSSAADSSFSAASSASANVTPHHTIAQESCPSPCSSASHFGVAHSSGFSSDPISPAVSSYAHMSYNYASSANTMTPSSASGTS
AHVAPGKQQFFASCFYSPWV
>Augustus_prediction2
MSSACTVVPPWSAGTLIERLPSLEDMAHKDNVIAMRNLPCLGTAGGSGLGGIAGKPSPTMEAVEASTASHPHSTSSYF
ATTYYHLTDDECHSGVNQLGGVFVGGRPLPDSTRQKIVELAHSGARPCDISRILQVSNGCVSKILGRYYETGSIRPRAIGGSKPRVATAEVVSKISQY
KRECPSIFAWEIRDRLLQENVCTNDNIPSVSSINRVLRNLAAQKEQQSTGSGSSSTSAGNSISAKVSVSIGGNVSNVASGSRGTLSSSTDLMQTATPL
NSSESGGASNSGEGSEQEAIYEKLRLLNTQHAAGPGPLEPARAAPLLVHGNHQALQQHQQQSWPPRHYSGSWYPTSLSEIPISSAPNIASVTAYASGP
SLAHSLSPPNDIESLASIGHQRNCPVATEDIHLKKELDGHQSDETGSGEGENSNGGASNIGNTEDDQARLILKRKLQRNRTSFTNDQIDSLEKEFERT
HYPDVFARERLAGKIGLPEARIQVWFSNRRAKWRREEKLRNQRRTPNSTGASATSSSTSATASLTDSPNSLSACSSLLSGSAGGPSVSTINGLSSPST
LSTNVNAPTLGAGIDSSESPTPIPHIRPSCTSDNDNGRQSEDCRRVCSPCPLGVGGHQNTHHIQSNGHAQGHALVPAISPRLNFNSGSFGAMYSNMHH
TALSMSDSYGAVTPIPSFNHSAVGPLAPPSPIPQQGDLTPSSLYPCHMTLRPPPMAPAHHHIVPGDGGRPAGVGLGSGQSANLGASCSGSGYEVLSAY
ALPPPPMASSSAADSSFSAASSASANVTPHHTIAQESCPSPCSSASHFGVAHSSGFSSDPISPAVSSYAHMSYNYASSANTMTPSSASGTSAHVAPGK
QQFFASCFYSPWV
The proteins predicted by Augustus are similar to each other, and are very close to isoform A of eyeless. Explain the discrepancy.
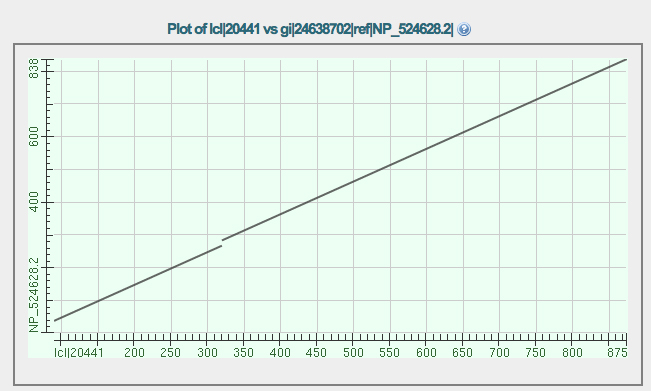
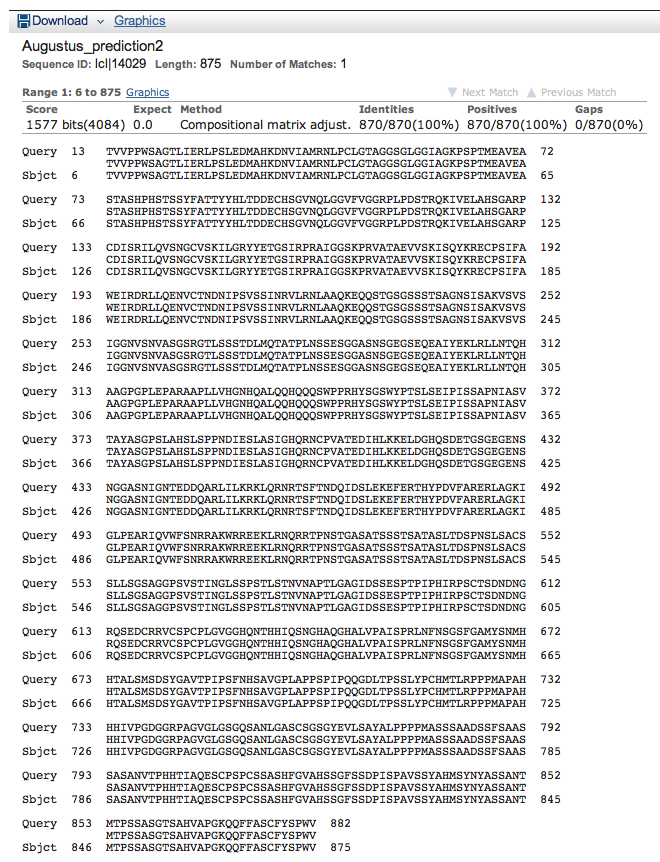
The dot plot and the alignment of Augustus protein 1 with isoform A of eyeless are shown below.
The dot plot and the alignment of Augustus protein 2 with isoform A of eyeless are shown below.
The dot plot and the alignment of Augustus protein 1 with Augustus protein 2 are shown below.
The list of top hits and the alignment of the best hit are shown below. The top two hits are isoforms of PAX6. There is a slight gap in the E values before significant hits on other members of the PAX gene family.
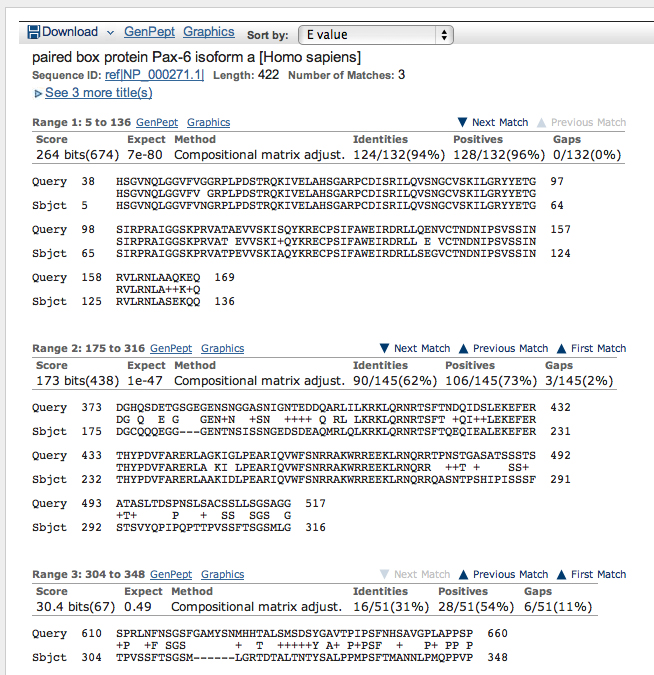
In the alignment, note that the three aligned segments have very different E values (listed under "Expect"). The first alignment is 94% identical, 96% positive. "Positive" in this context means that the amino acid substitutions are conservative. All eight amino acid substitutions from the best-matched segment in the first alignment are shown below.
You can review the structures of the amino acids at the entry on proteinogenic amino acids at Wikipedia.
The evaluation of conservative vs. nonconservative amino acid substitutions is made using a Blosum matrix.
| Query Position (Drosophila eyeless) |
Subject Position (Human PAX6) |
Change (Drosophila -> Human) |
Change Type |
| 50 | 17 | G (GLY) -> N (ASN) | nonconservative |
| 114 | 81 | A (ALA) -> P (PRO) | nonconservative |
| 121 | 88 | S (SER) -> A (ALA) | conservative |
| 141 | 108 | Q (GLN) -> S (SER) | nonconservative |
| 143 | 110 | N (ASN) -> G (GLY) | nonconservative |
| 165 | 132 | A (ALA) -> S (SER) | conservative |
| 166 | 133 | Q (GLN) -> E (GLU) | conservative |
| 168 | 135 | E (GLU) -> Q (GLN) | conservative |
It is a good idea to look through the FlyBase entry on eyeless. You will find that the gene is named by the first obvious phenotypic difference that mutant flies exhibited: they have small eyes, or sometimes no eyes. There are dominant alleles that produce small eyes when heterozygous. These are lethal when homozygous, with the affected flies dying as pupae.
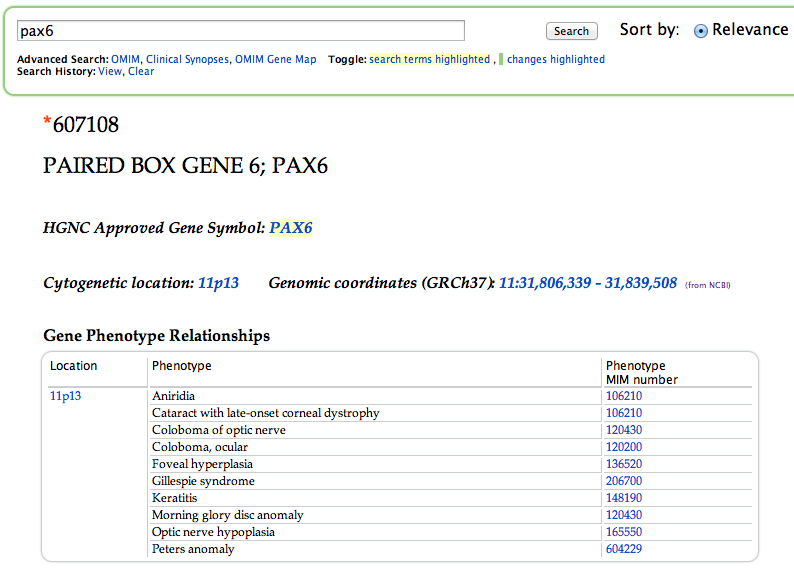
The human ortholog, PAX6, also has mutant alleles associated with eye defects in people. This is evident from the top of the OMIM entry for PAX6, shown in the screen shot below. At the OMIM entry for PAX6, clicking the link from any of the MIM numbers will take you to the phenotype entry.
The mouse ortholog, Pax6, has mutant alleles associated with dominant small eyes and recessive lethality. There is a lot to learn about Pax6 at MGI.